
XRP has entered a crucial support region after suffering an aggressive selloff over the past two weeks. While buyers have managed to prevent a deeper breakdown for now, the asset remains trapped within a broader downtrend, leaving the current rebound vulnerable unless key resistance levels are reclaimed.
Ripple Price Analysis: The Daily Chart
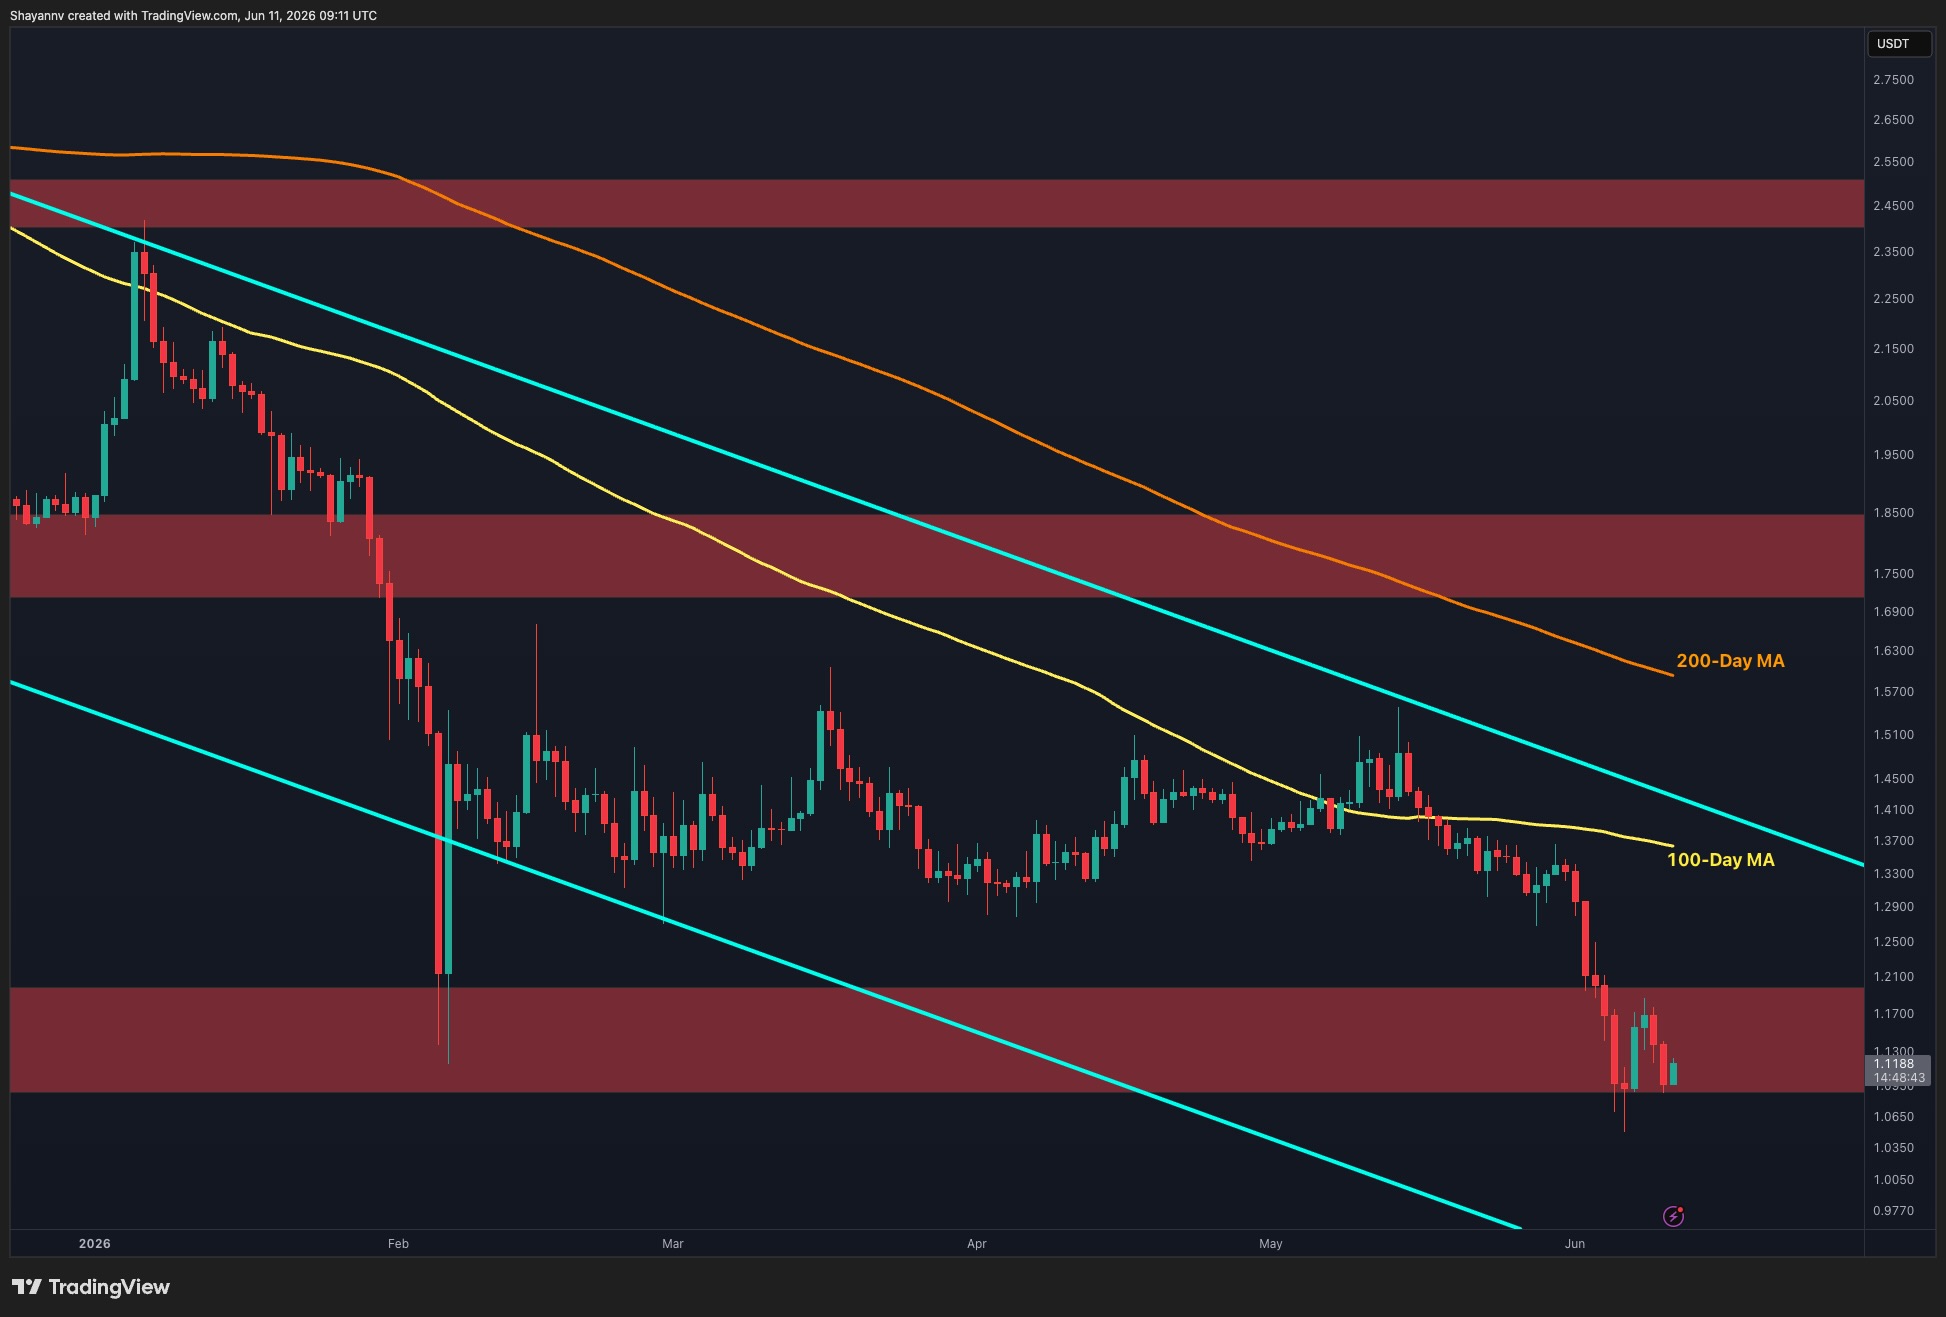
The daily chart shows XRP trading inside a long-term descending channel, with the price recently breaking below the lower boundary of a multi-month consolidation range.
The recent selloff pushed XRP into the highlighted support region around $1.08-$1.20, where buyers managed to generate a reaction. However, the recovery has been relatively weak so far, indicating that demand remains limited. As long as the asset stays beneath the former support zone around $1.70-$1.85, any upside movement is likely to be viewed as a corrective bounce rather than a trend reversal.
On the upside, the first significant resistance sits near the descending channel boundary and the 100-day MA around $1.35-$1.40. A successful reclaim of that area would be needed to improve the technical outlook. Beyond that, the $1.70-$1.85 supply zone represents the next major obstacle. Failure to hold the current demand area could expose the lows around $1.05 and potentially open the door for a deeper decline.
XRP/USDT 4-Hour Chart
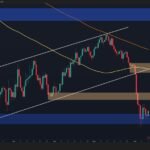
The 4-hour chart provides a clearer view of the recent breakdown. The recent sharp drop eventually found support near the red demand zone around $1.08-$1.10, which coincides with the measured move target from the breakdown. Since then, XRP has staged a modest recovery, but the bounce has so far produced only a lower high structure, keeping the short-term trend bearish.
For bulls, reclaiming the $1.21 level would be the first sign that momentum is stabilizing. Above that, the $1.25-$1.30 region remains the most important resistance cluster, as it combines previous support turned resistance with multiple Fibonacci levels. A breakout above this zone could trigger a stronger relief rally toward $1.36.
On the downside, the $1.08-$1.10 support area remains critical. A decisive breakdown below this zone would invalidate the current rebound attempt and increase the probability of a retest of the $1.05 swing low shown on the chart.
Overall, the higher timeframe trend remains bearish, while the 4-hour chart suggests XRP is attempting to build a short-term base above support. The next directional move will likely depend on whether buyers can reclaim the $1.21-$1.30 resistance cluster or whether sellers force a breakdown below $1.08.

A poszt Ripple Price Analysis: XRP’s Weak Recovery Points to More Downside Ahead jelent meg először a CryptoPotato.


Vélemény, hozzászólás?