
Bitcoin has stabilized following its sharp decline from the mid-$80K region, with the price gradually making higher lows on the lower timeframes. Although short-term momentum has improved, the broader trend remains challenged as BTC continues to trade beneath key moving averages and several overhead resistance zones.
Bitcoin Price Analysis: The Daily Chart
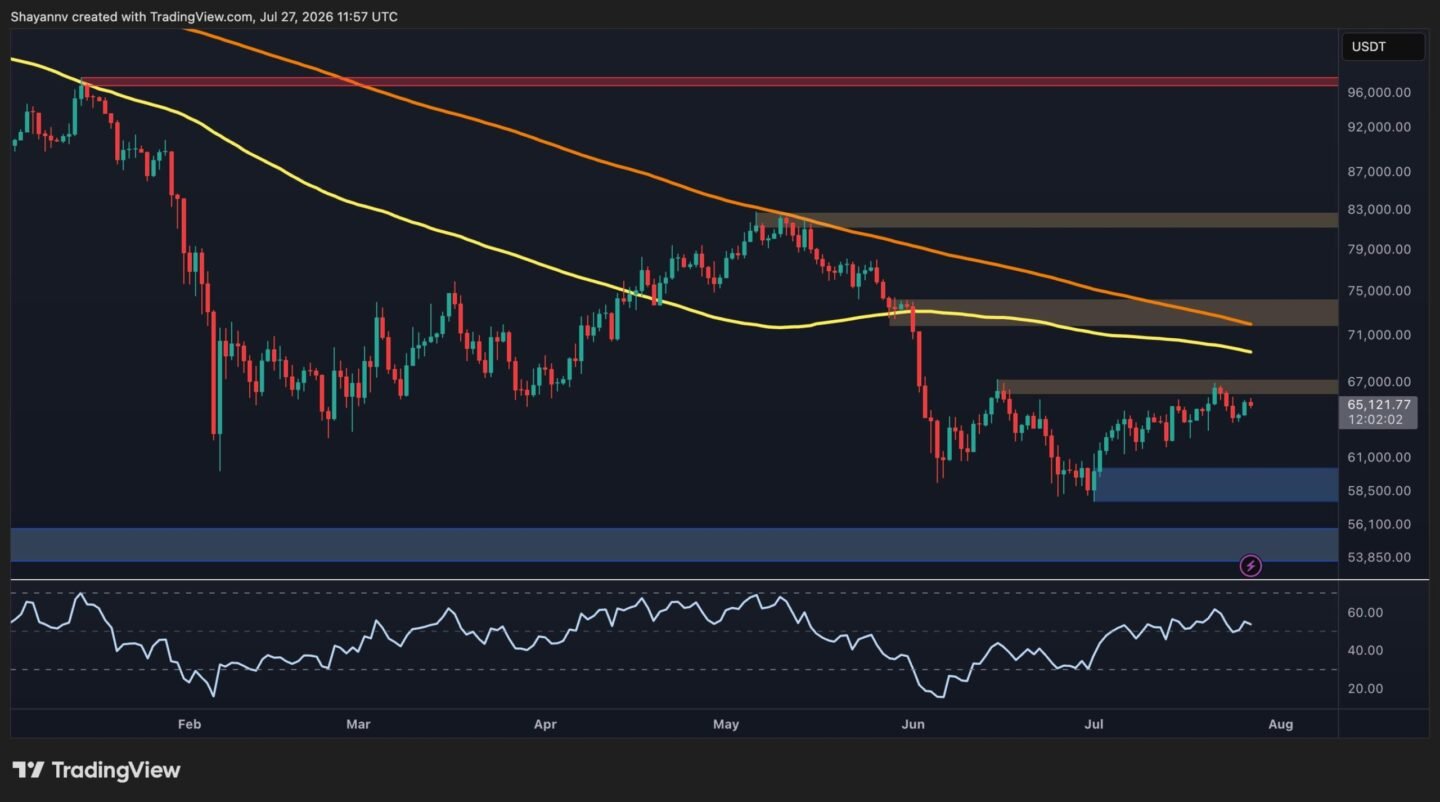
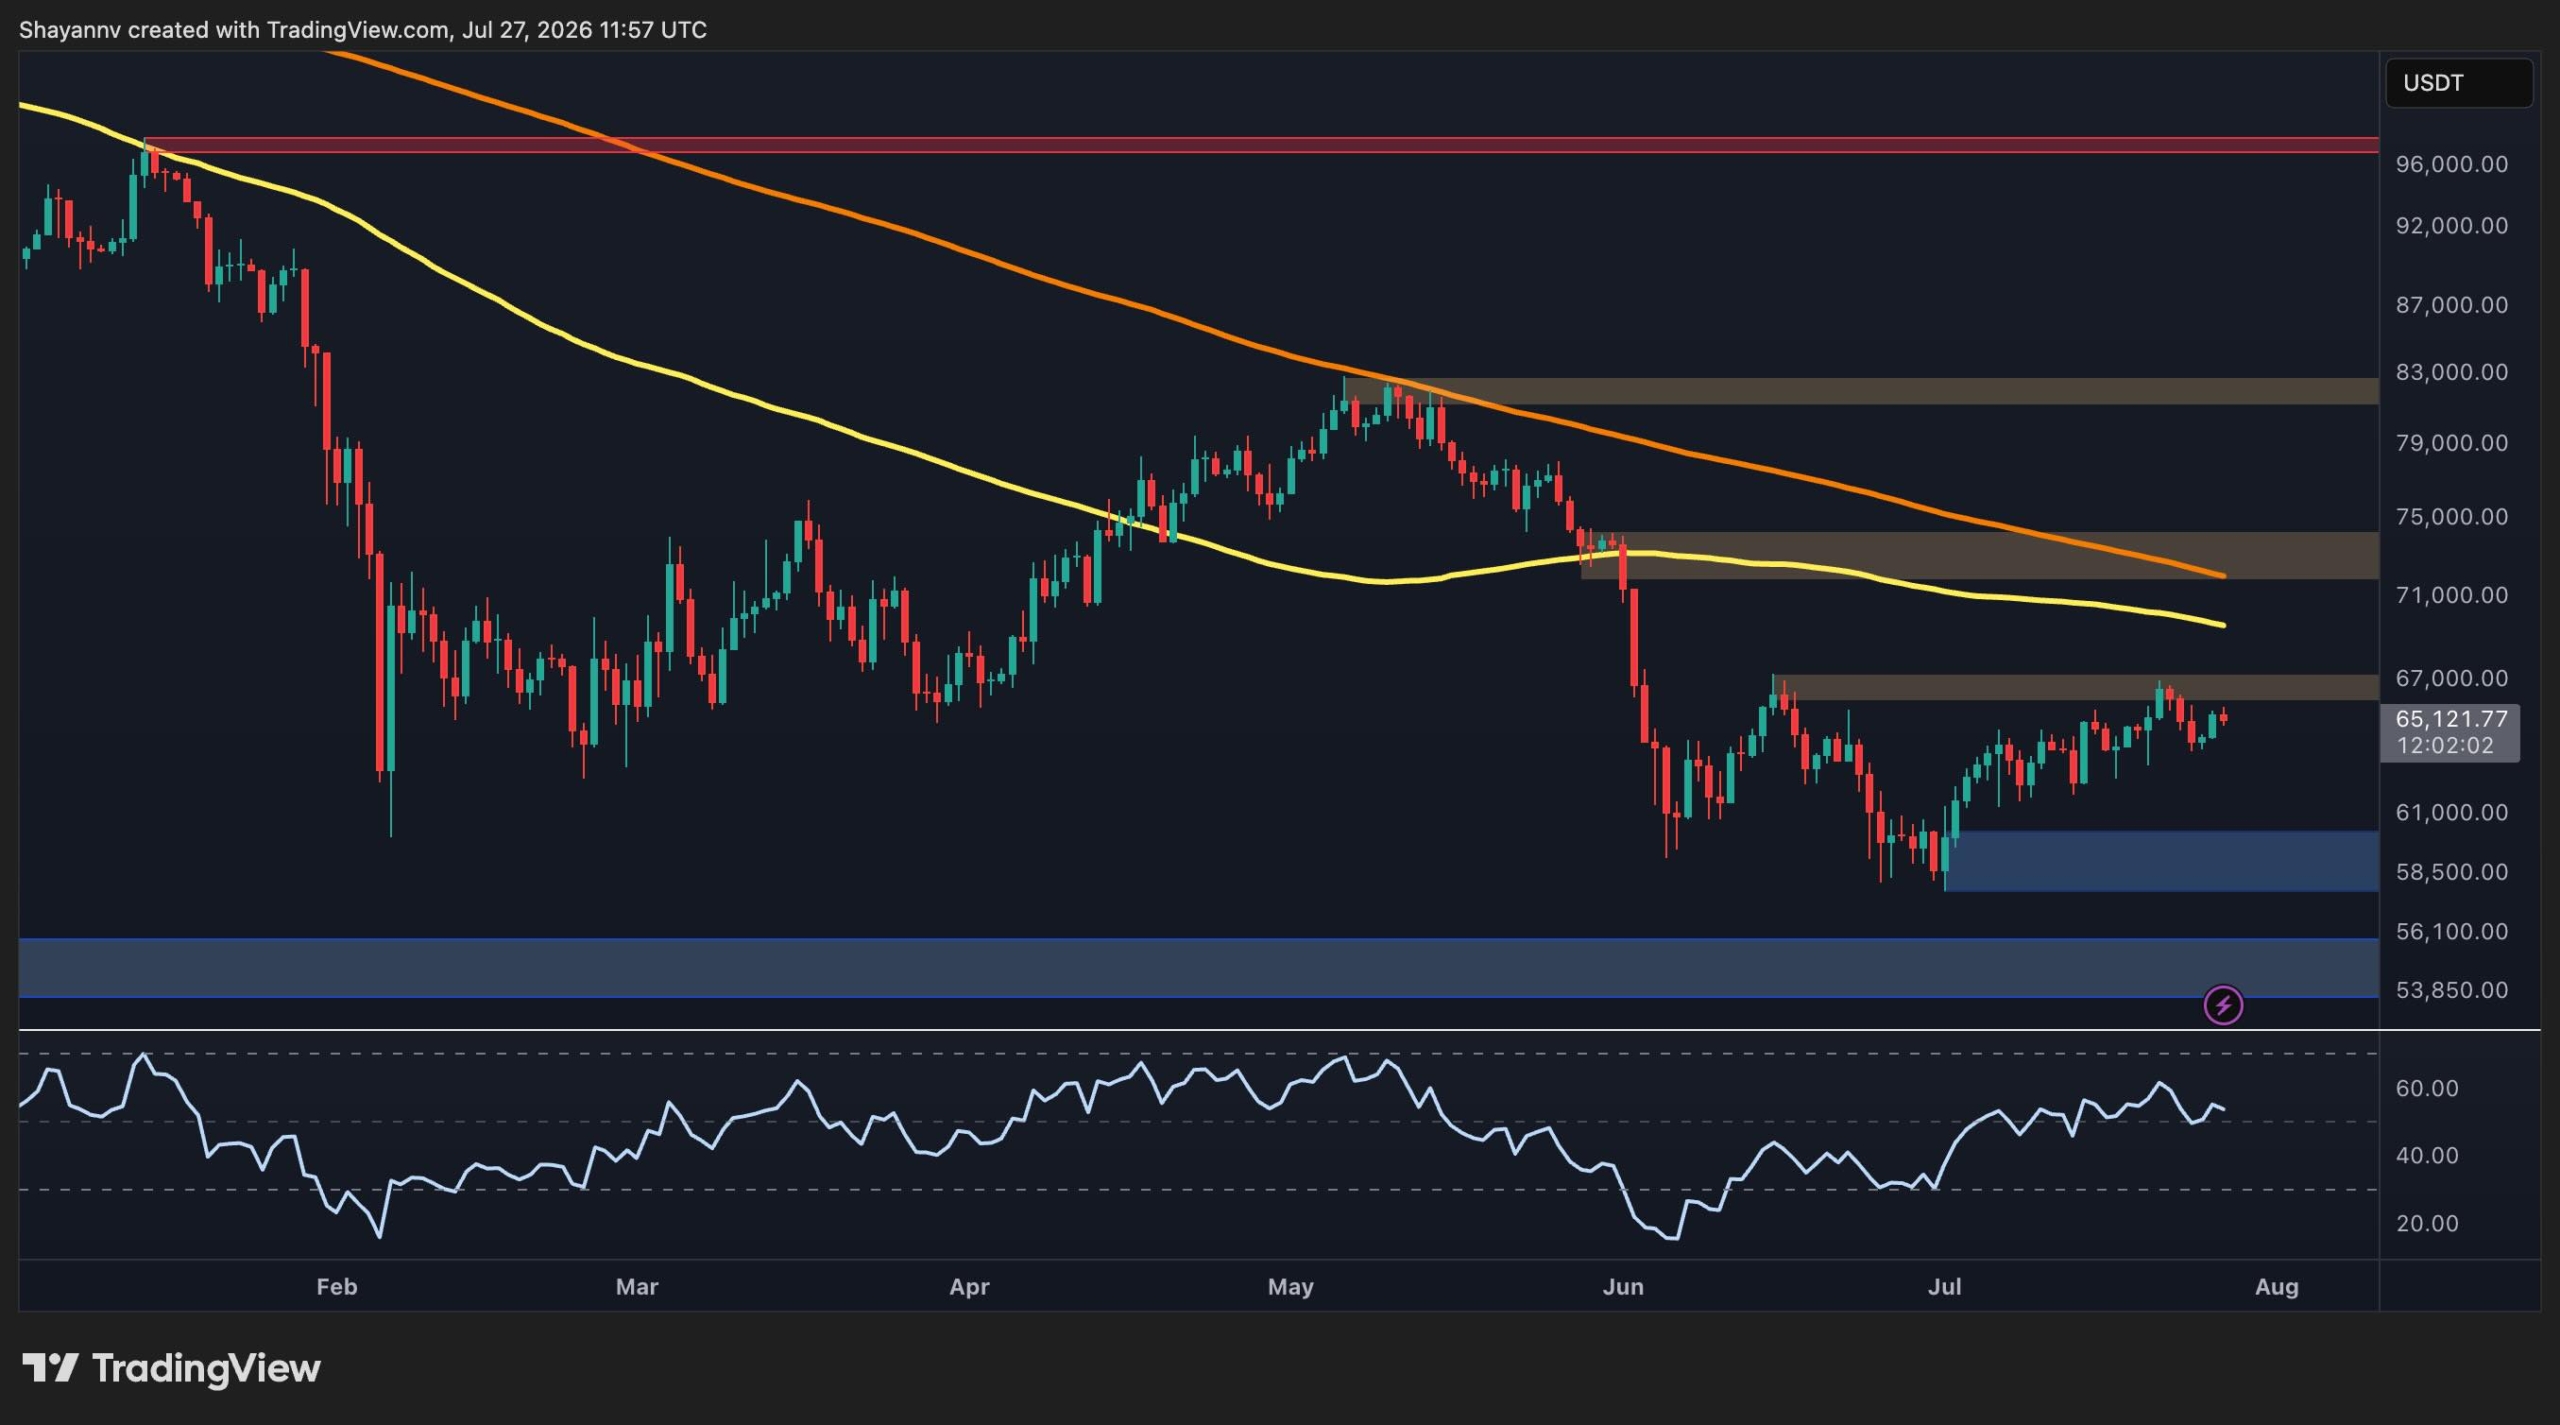
On the daily timeframe, BTC is trading around $65K after bouncing from the $60K demand area. The recovery has been constructive, but the market remains below both the 100-day moving average near $69K and the 200-day moving average around $72K, leaving the broader structure tilted to the downside.
The first major resistance sits at $67K, where price is currently testing a previously established supply zone. A successful breakout above this region could expose the next resistance cluster around $72K to $74K, which closely aligns with the declining moving averages. Beyond that, the $82K supply zone represents the primary bullish hurdle before any discussion of a larger trend reversal.
On the downside, the $60K support area remains the key level to monitor. Below that, the broader demand region around $54K to $56K would likely become the next destination if sellers regain control.
Momentum has also improved modestly, with the RSI climbing back toward the midline after recovering from oversold territory. However, the indicator has yet to enter strong bullish territory, suggesting buyers still need additional confirmation before establishing sustained upside momentum.
BTC/USDT 4-Hour Chart
The 4-hour chart presents a more worrying picture at the moment. Following the June selloff, Bitcoin formed a sequence of higher lows inside an ascending structure. However, the asset has broken below the lower trendline of the pattern and is currently retesting it. This breakout has shifted near-term momentum in favor of sellers.
The market is now consolidating inside the $65K to $66K resistance zone, just below the pattern, where sellers have seemingly stepped in. A decisive close above this area could trigger another leg higher toward the $67K region initially, while opening the path toward the higher daily resistance levels afterward.
On the other hand, failure to overcome this supply zone would likely trigger another pullback toward the $63.5K short-term support area. As long as this region holds, the short-term bullish structure remains intact. Losing it, however, would increase the probability of a deeper retracement toward the $60K demand zone.

Sentiment Analysis
The Adjusted Spent Output Profit Ratio (aSOPR) provides insight into whether coins moved on-chain are being sold at a profit or a loss. Readings above 1 indicate that holders are, on average, realizing profits, while values below 1 suggest coins are being spent at a loss.
The 30-day EMA of the aSOPR has remained below the neutral 1.0 level for several months, reflecting an extended period of subdued profitability and reduced selling pressure. More recently, however, the indicator has started to recover and is gradually moving back toward the equilibrium line.
This improvement suggests that profit-taking pressure is easing as the market stabilizes. If the aSOPR manages to reclaim and sustain levels above 1, it would indicate that realized profitability has returned without triggering aggressive distribution, a development that has historically supported healthier recovery phases.
Conversely, another decline below the neutral threshold would imply that market participants remain hesitant, increasing the risk that Bitcoin’s current rebound evolves into another relief rally rather than the beginning of a broader bullish trend.

A poszt Bitcoin Price Analysis: Only a Break Above This Level Will Confirm BTC’s Recovery jelent meg először a CryptoPotato.












 Magyar
  English
  Română
  Eesti
Eesti  한국어
한국어  日本語
日本語  Русский
  Deutsch
  Español
  简体中文
简体中文  Français
  繁體中文
繁體中文  Português
  Italiano
  Polski
  Türkçe
  Nederlands
  Bahasa Indonesia
  Ελληνικά
  Українська
  Български
  Čeština
  Suomi
Suomi  Latviešu valoda
  Lietuvių kalba
  Norsk bokmål
  Slovenčina
  Slovenščina
  Svenska
Vélemény, hozzászólás?