Ethereum has pulled back slightly after tagging the $4,000 resistance level, which capped the recent explosive rally. While the short-term correction shook out late long positions, on-chain data still leans bullish. As we move into August, price action, RSI levels, and supply metrics hint at the next major move.
Technical Analysis
By ShayanMarkets
The Daily Chart
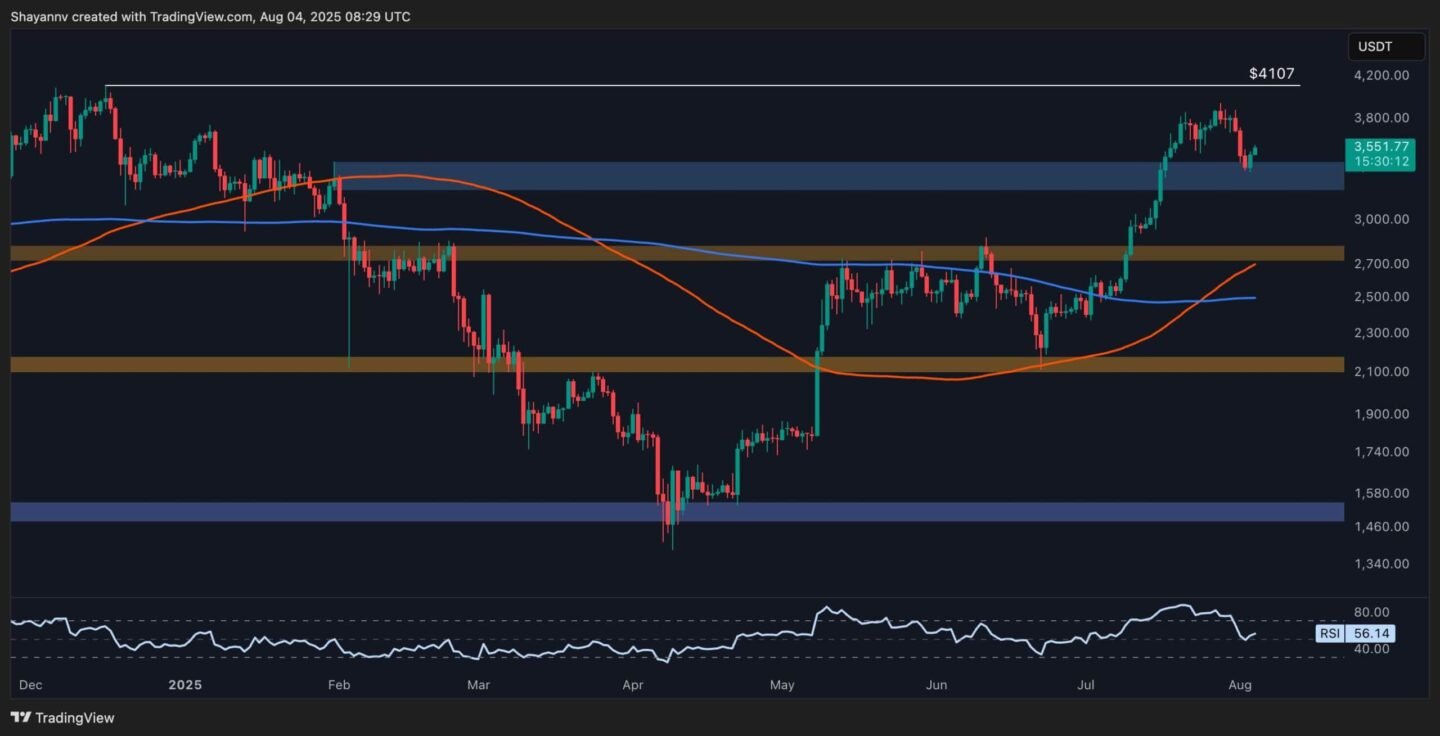
ETH’s daily chart remains structurally bullish despite the recent retracement. After the breakout above the $2,800 resistance level, the price surged past the $3,500 resistance zone, eventually stalling near $4,000. This area aligns with prior swing highs from late 2024 and is acting as strong resistance for now.
The asset has now retraced back toward the broken resistance at $3,500, which is being retested as support. The RSI has also cooled from overbought levels and is currently hovering near 56, allowing room for another move up if buyers step in.
Moreover, the 100-day moving average is accelerating above the 200-day moving average, confirming a bullish golden cross structure. As a result, momentum remains in favor of the bulls as long as ETH stays above the $3,500 range. If this zone breaks, the next support lies at $2,800 and then $2,500.
On the upside, reclaiming $3,700 would open the door for another test of the $4,100 highs. A confirmed breakout above that level could trigger a move toward $4,400–$4,500.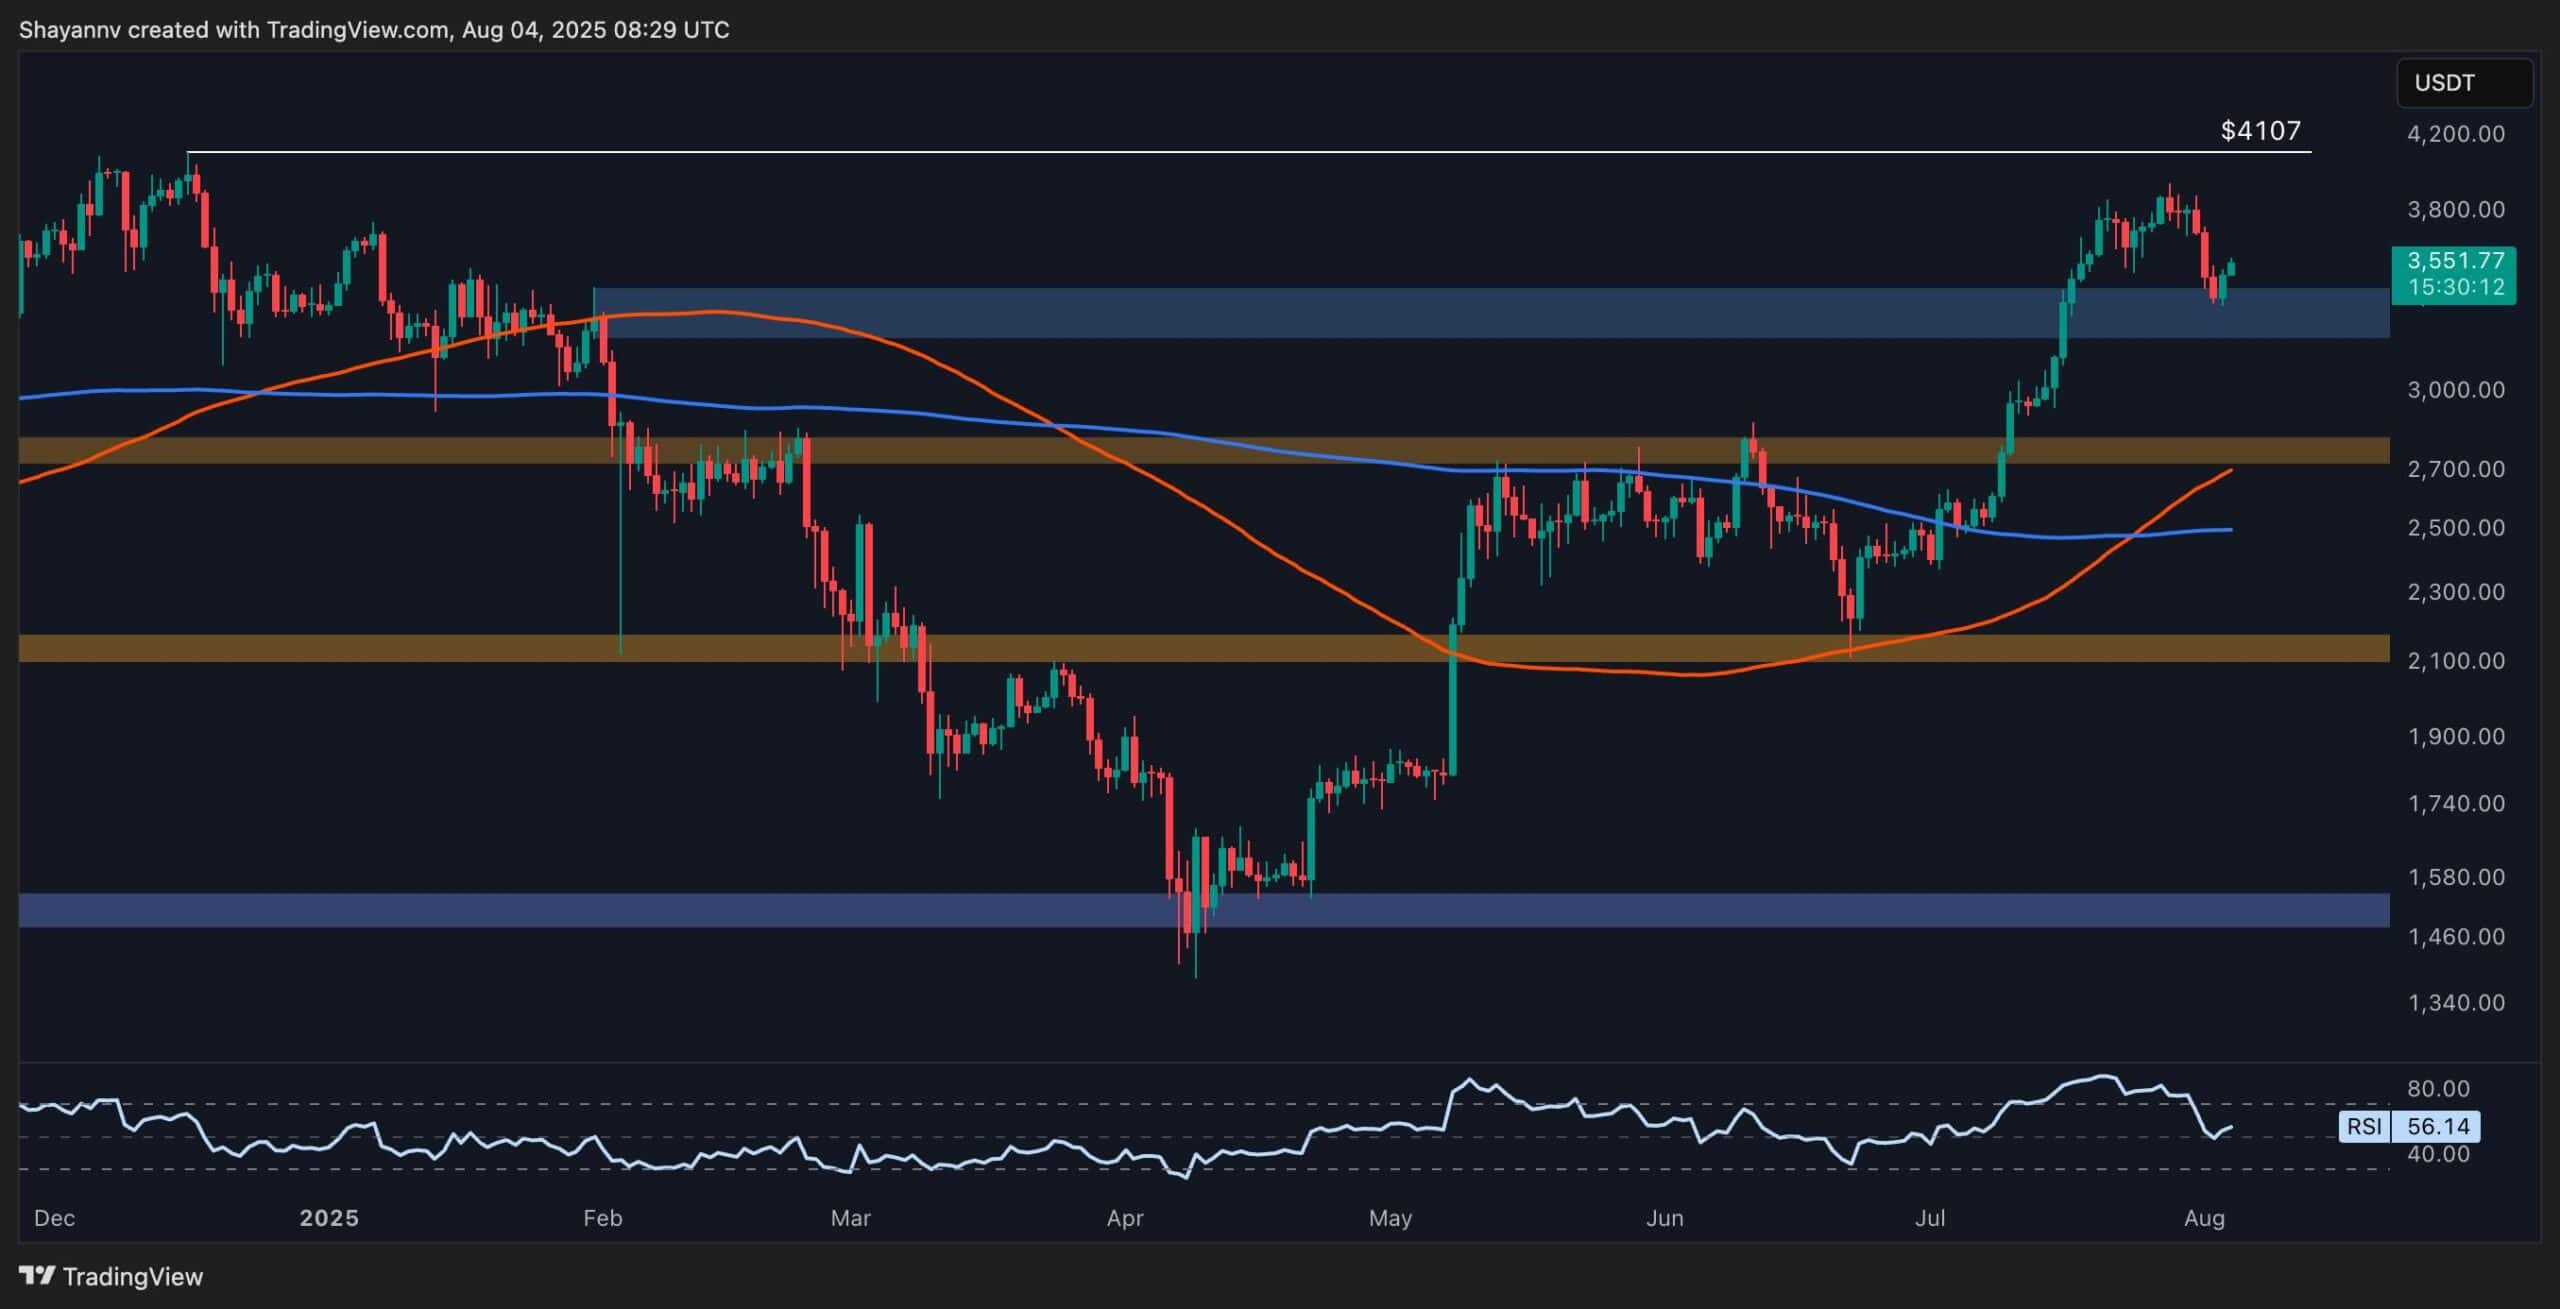
The 4-Hour Chart
The 4-hour chart shows ETH breaking down from a rising wedge formation, a pattern often associated with exhaustion after a prolonged rally. After multiple failed attempts to break above $4,000, ETH rolled over and fell toward $3,350 before finding short-term support.
The move coincided with a bearish divergence on RSI, signaling weakening momentum before the drop. Since then, the price has formed a local base around $3,350–$3,500, with the buyers attempting to regain control.
For now, ETH is stuck in a short-term range between $3,500 and $3,750. A clean break above this range could trigger another move toward the $4,000 region. However, if the buyers fail to hold the $3,500 area, we might see further downside into the $3,300 or even the $3,100 zone. This is a key area where both the sellers and the buyers are battling for short-term momentum.
Onchain Analysis
Exchange Supply Ratio
The Ethereum Exchange Supply Ratio continues to trend lower, hitting a fresh multi-year low at 0.13. This metric measures the proportion of ETH held on exchanges relative to the total supply.
A falling ratio indicates that less ETH is being held on centralized exchanges, suggesting that holders are moving their coins into cold wallets, staking contracts, or custody solutions. It’s often interpreted as a bullish signal since it reduces the immediate supply available to sell on the open market.
This trend has been in place for the past few years and aligns with Ethereum’s broader shift toward becoming a yield-bearing asset post-Merge. Despite recent price volatility, investors appear to be sticking to a long-term accumulation strategy.
With less ETH available on exchanges, even moderate demand could trigger sharp price movements to the upside. Unless this ratio reverses with a sudden inflow of supply back onto exchanges or a futures liquidation cascade occurs, the overall market structure remains bullish from a supply-side perspective.
Inlägget Ethereum Price Analysis: Is ETH Gearing Up for a $4K Breakout? publicerades först på CryptoPotato.


Lämna ett svar