
XRP price extended losses and traded below $1.450. The price is now consolidating losses and faces hurdles near $1.420 and $1.4370.
- XRP price started another decline and traded below the $1.3550 zone.
- The price is now trading below $1.350 and the 100-hourly Simple Moving Average.
- There is a bearish trend line forming with resistance at $1.420 on the hourly chart of the XRP/USD pair (data source from Kraken).
- The pair could continue to move down if it stays below $1.450.
XRP Price Dips Again
XRP price failed to stay above $1.4850 and extended its decline, underperforming Биткойн и Ethereum. The price declined below $1.4650 and $1.450 to enter a short-term bearish zone.
The price even extended losses below $1.4250. A low was formed at $1.3917, and the price is now consolidating losses. There was a minor upward move toward the 23.6% Fib retracement level of the downward move from the $1.510 swing high to the $1.3917 low.
The price is now trading below $1.4250 and the 100-hourly Simple Moving Average. If there is a fresh recovery move, the price might face resistance near the $1.420 level. There is also a bearish trend line forming with resistance at $1.420 on the hourly chart of the XRP/USD pair.
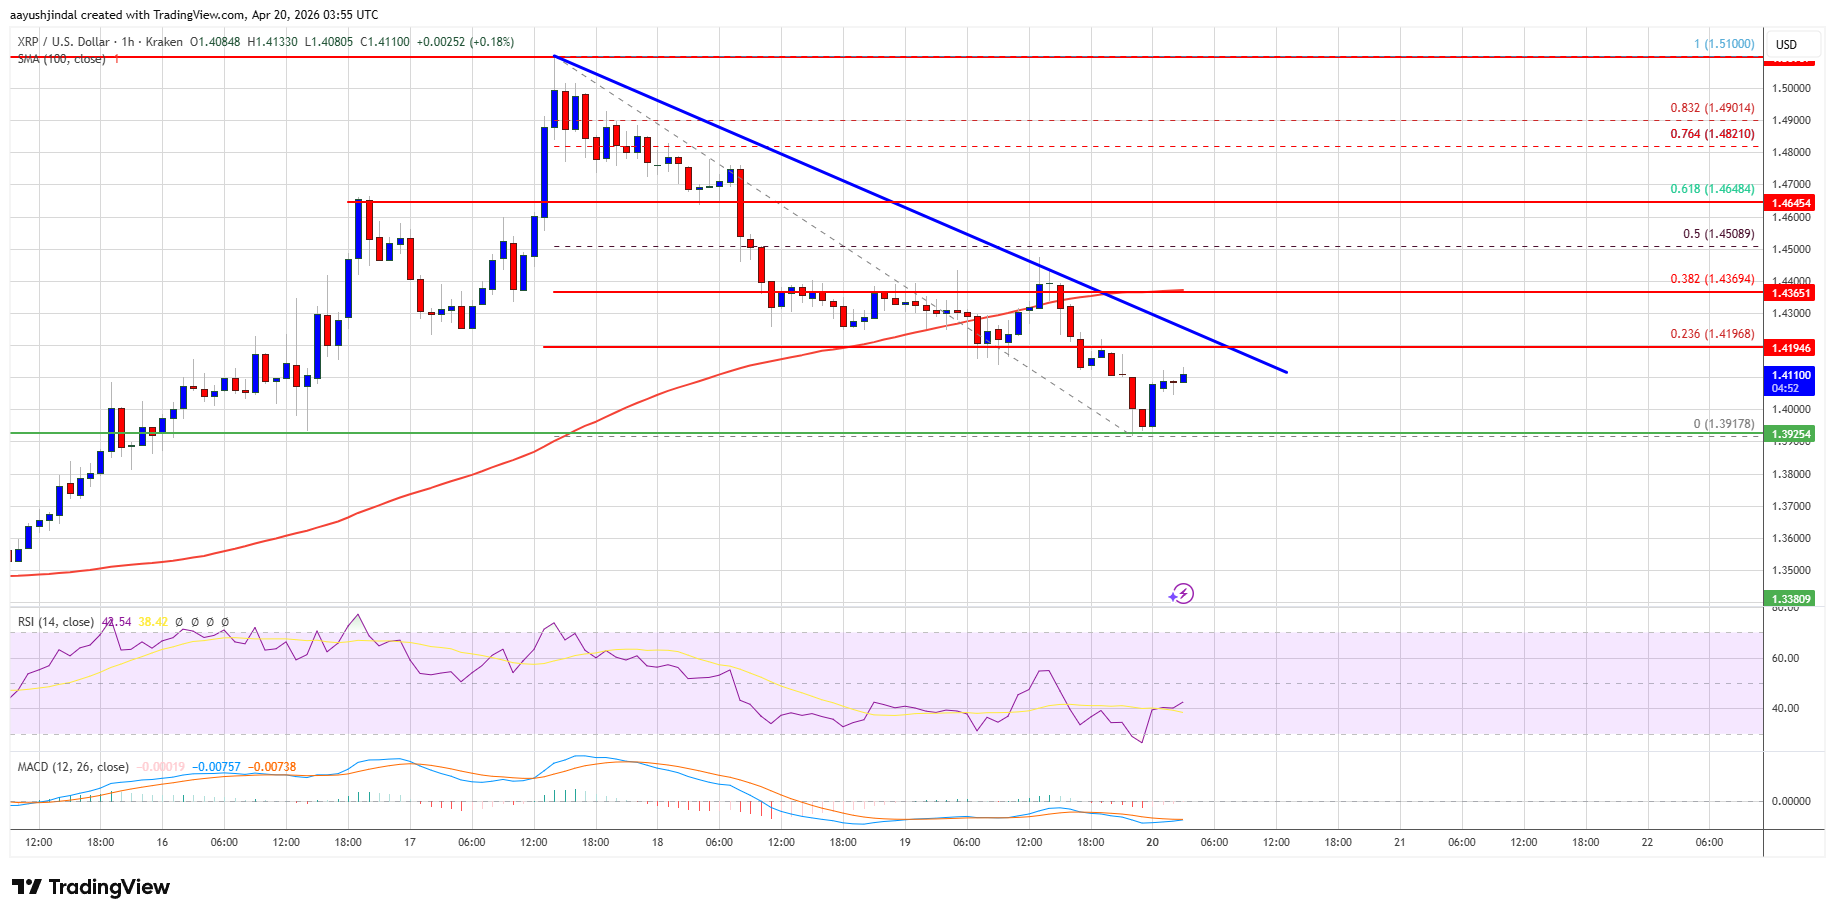
The first major resistance is near the $1.4370 level or the 38.2% Fib retracement level of the downward move from the $1.510 swing high to the $1.3917 low. The main resistance could be $1.4650. A close above $1.4650 could send the price to $1.4820. The next hurdle sits at $1.4880. A clear move above the $1.4880 resistance might send the price toward the $1.50 resistance. Any more gains might send the price toward the $1.5150 resistance.
Еще больше потерь?
If XRP fails to clear the $1.420 resistance zone, it could start a fresh decline. Initial support on the downside is near the $1.40 level. The next major support is near the $1.3840 level.
If there is a downside break and a close below the $1.3840 level, the price might continue to decline toward $1.3650. The next major support sits near the $1.350 zone, below which the price could continue lower toward $1.3220.
Технические индикаторы
Hourly MACD – The MACD for XRP/USD is now gaining pace in the bearish zone.
Часовой RSI (индекс относительной силы) - Индекс RSI для XRP/USD сейчас находится ниже уровня 50.
Major Support Levels – $1.4000 and $1.3840.
Major Resistance Levels – $1.4200 and $1.4370.


Добавить комментарий