Ethereum is trading above $2.2k as the third week of May gets underway. The asset is on the lower end of its range over the past two weeks after another rejection. The aggressive long positioning that had built up into the $2.4k resistance zone has been unwound, and the price chart indicates that more consolidation is likely to happen in the coming days.
Ethereum Price Analysis: The Daily Chart
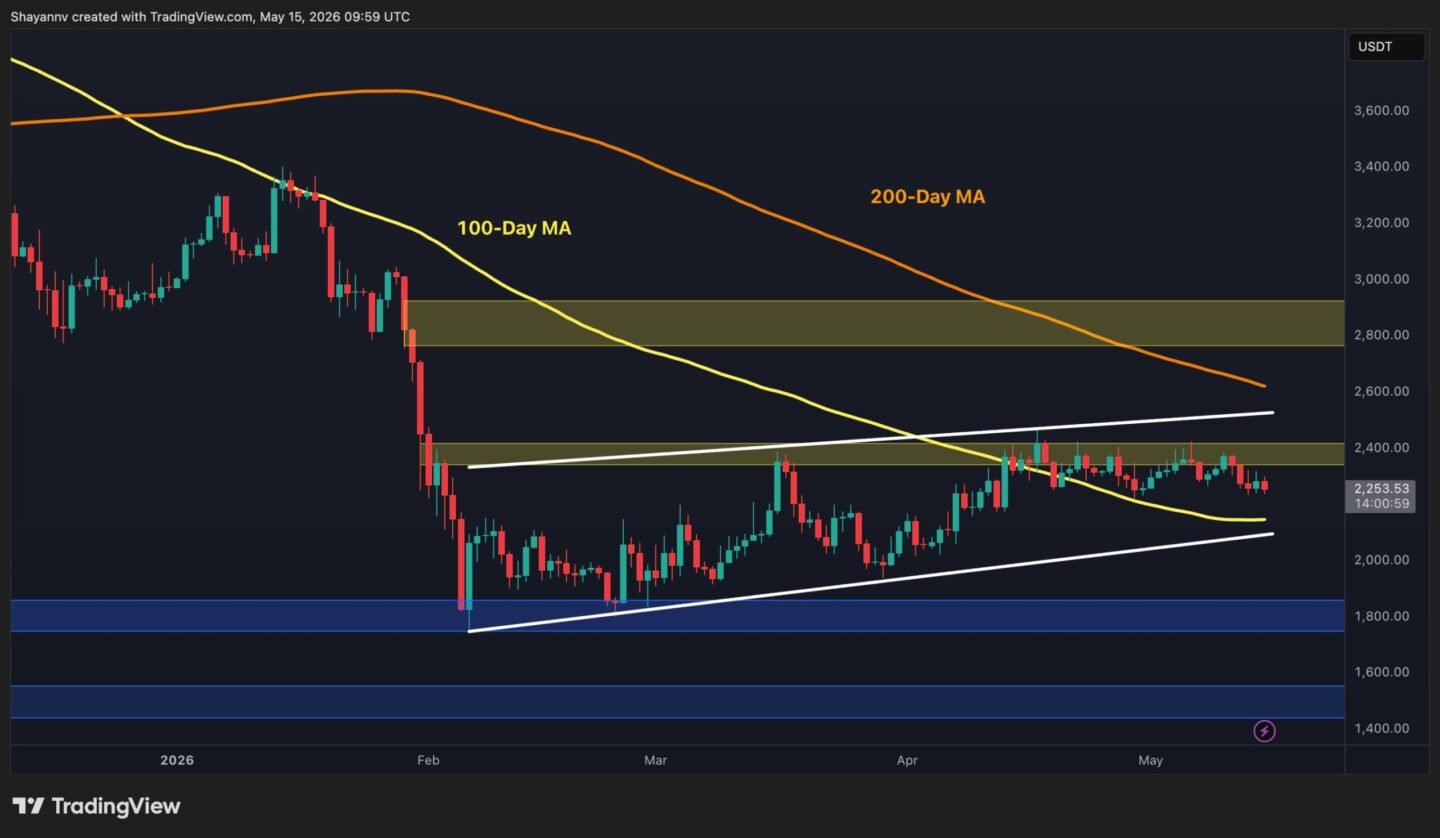
On the daily chart, ETH is still trading above the 100-day moving average (~$2.15k), which is currently the only positive sign on this timeframe. The mildly ascending channel from the February low also remains technically intact, and its lower boundary is rising toward $2.1k and will act as another dynamic support level.
The $2.4k supply zone has now rejected ETH several times without a single sustained close above it. The 200-day moving average (~$2.6k) is the next ceiling above the horizontal level and the higher boundary of the channel.
To rebuild the case for a recovery, ETH needs to first stabilize above the $2.4k resistance level and then reclaim the 200-day moving average, but neither of these moves looks straightforward given current momentum. On the downside, a close below $2k would be the massive structural damage that the buyers would have to prevent from happening.

ETH/USDT 4-Hour Chart
The pink descending wedge that had been compressing the price since the mid-April high is resolving to the downside, as the lower boundary near $2.26k is getting broken. The asset is now sitting just above the $2.2k support zone that has held on during recent weeks. The RSI on this timeframe is hovering in the 40–45 range, soft but not yet at the oversold levels that could trigger a bounce from this support band.
The $2.2k zone is the critical level to watch over the next few days. A successful rebound here would keep the short-term bullish structure alive and set up another attempt at reclaiming the $2.4k zone. However, a confirmed break below $2.2k opens the door toward the $2k-$2.1k support zone and the daily channel’s lower boundary as the last meaningful lines of defense before $1.8k.

Sentiment Analysis
After hitting a multi-year low of approximately 14.5M ETH in late April, exchange reserves have ticked back up to 14.9M, which is a modest increase of around 400k ETH over the past few days. The timing is important because the reserve increase began as the price approached $2.4k and has continued through the pullback to current levels.
This suggests that a portion of the ETH returning to exchanges represents holders who accumulated near the February lows and moved supply onto exchanges as the price approached their target exit zone.
Yet, the broader picture remains structurally supportive. 14.9M ETH is still historically low by any measure, and the multi-month outflow trend has not reversed. But the subtle shift from declining to slightly rising reserves at exactly the resistance level that has rejected the price several times is not coincidental. It helps explain why $2.4k has been so difficult to clear.
Each approach has triggered incremental supply from low-cost holders, absorbing demand before a breakout can materialize. Until reserve flows resume their decline, signaling that those holders have finished distributing, the supply wall at $2.4k is likely to persist.

Pranešimas Ethereum Price Analysis: Is ETH Finally Attempting a Real Breakout? appeared first on CryptoPotato.


Parašykite komentarą