
Ethereum remains under pressure across higher and lower timeframes after failing to reclaim key resistance levels.
The asset has broken below a multi-month bullish structure on the daily chart while continuing to trade inside a descending channel on the 4-hour timeframe.
Meanwhile, sentiment data suggests that aggressive buyers remain largely absent.
Ethereum Price Analysis: The Daily Chart
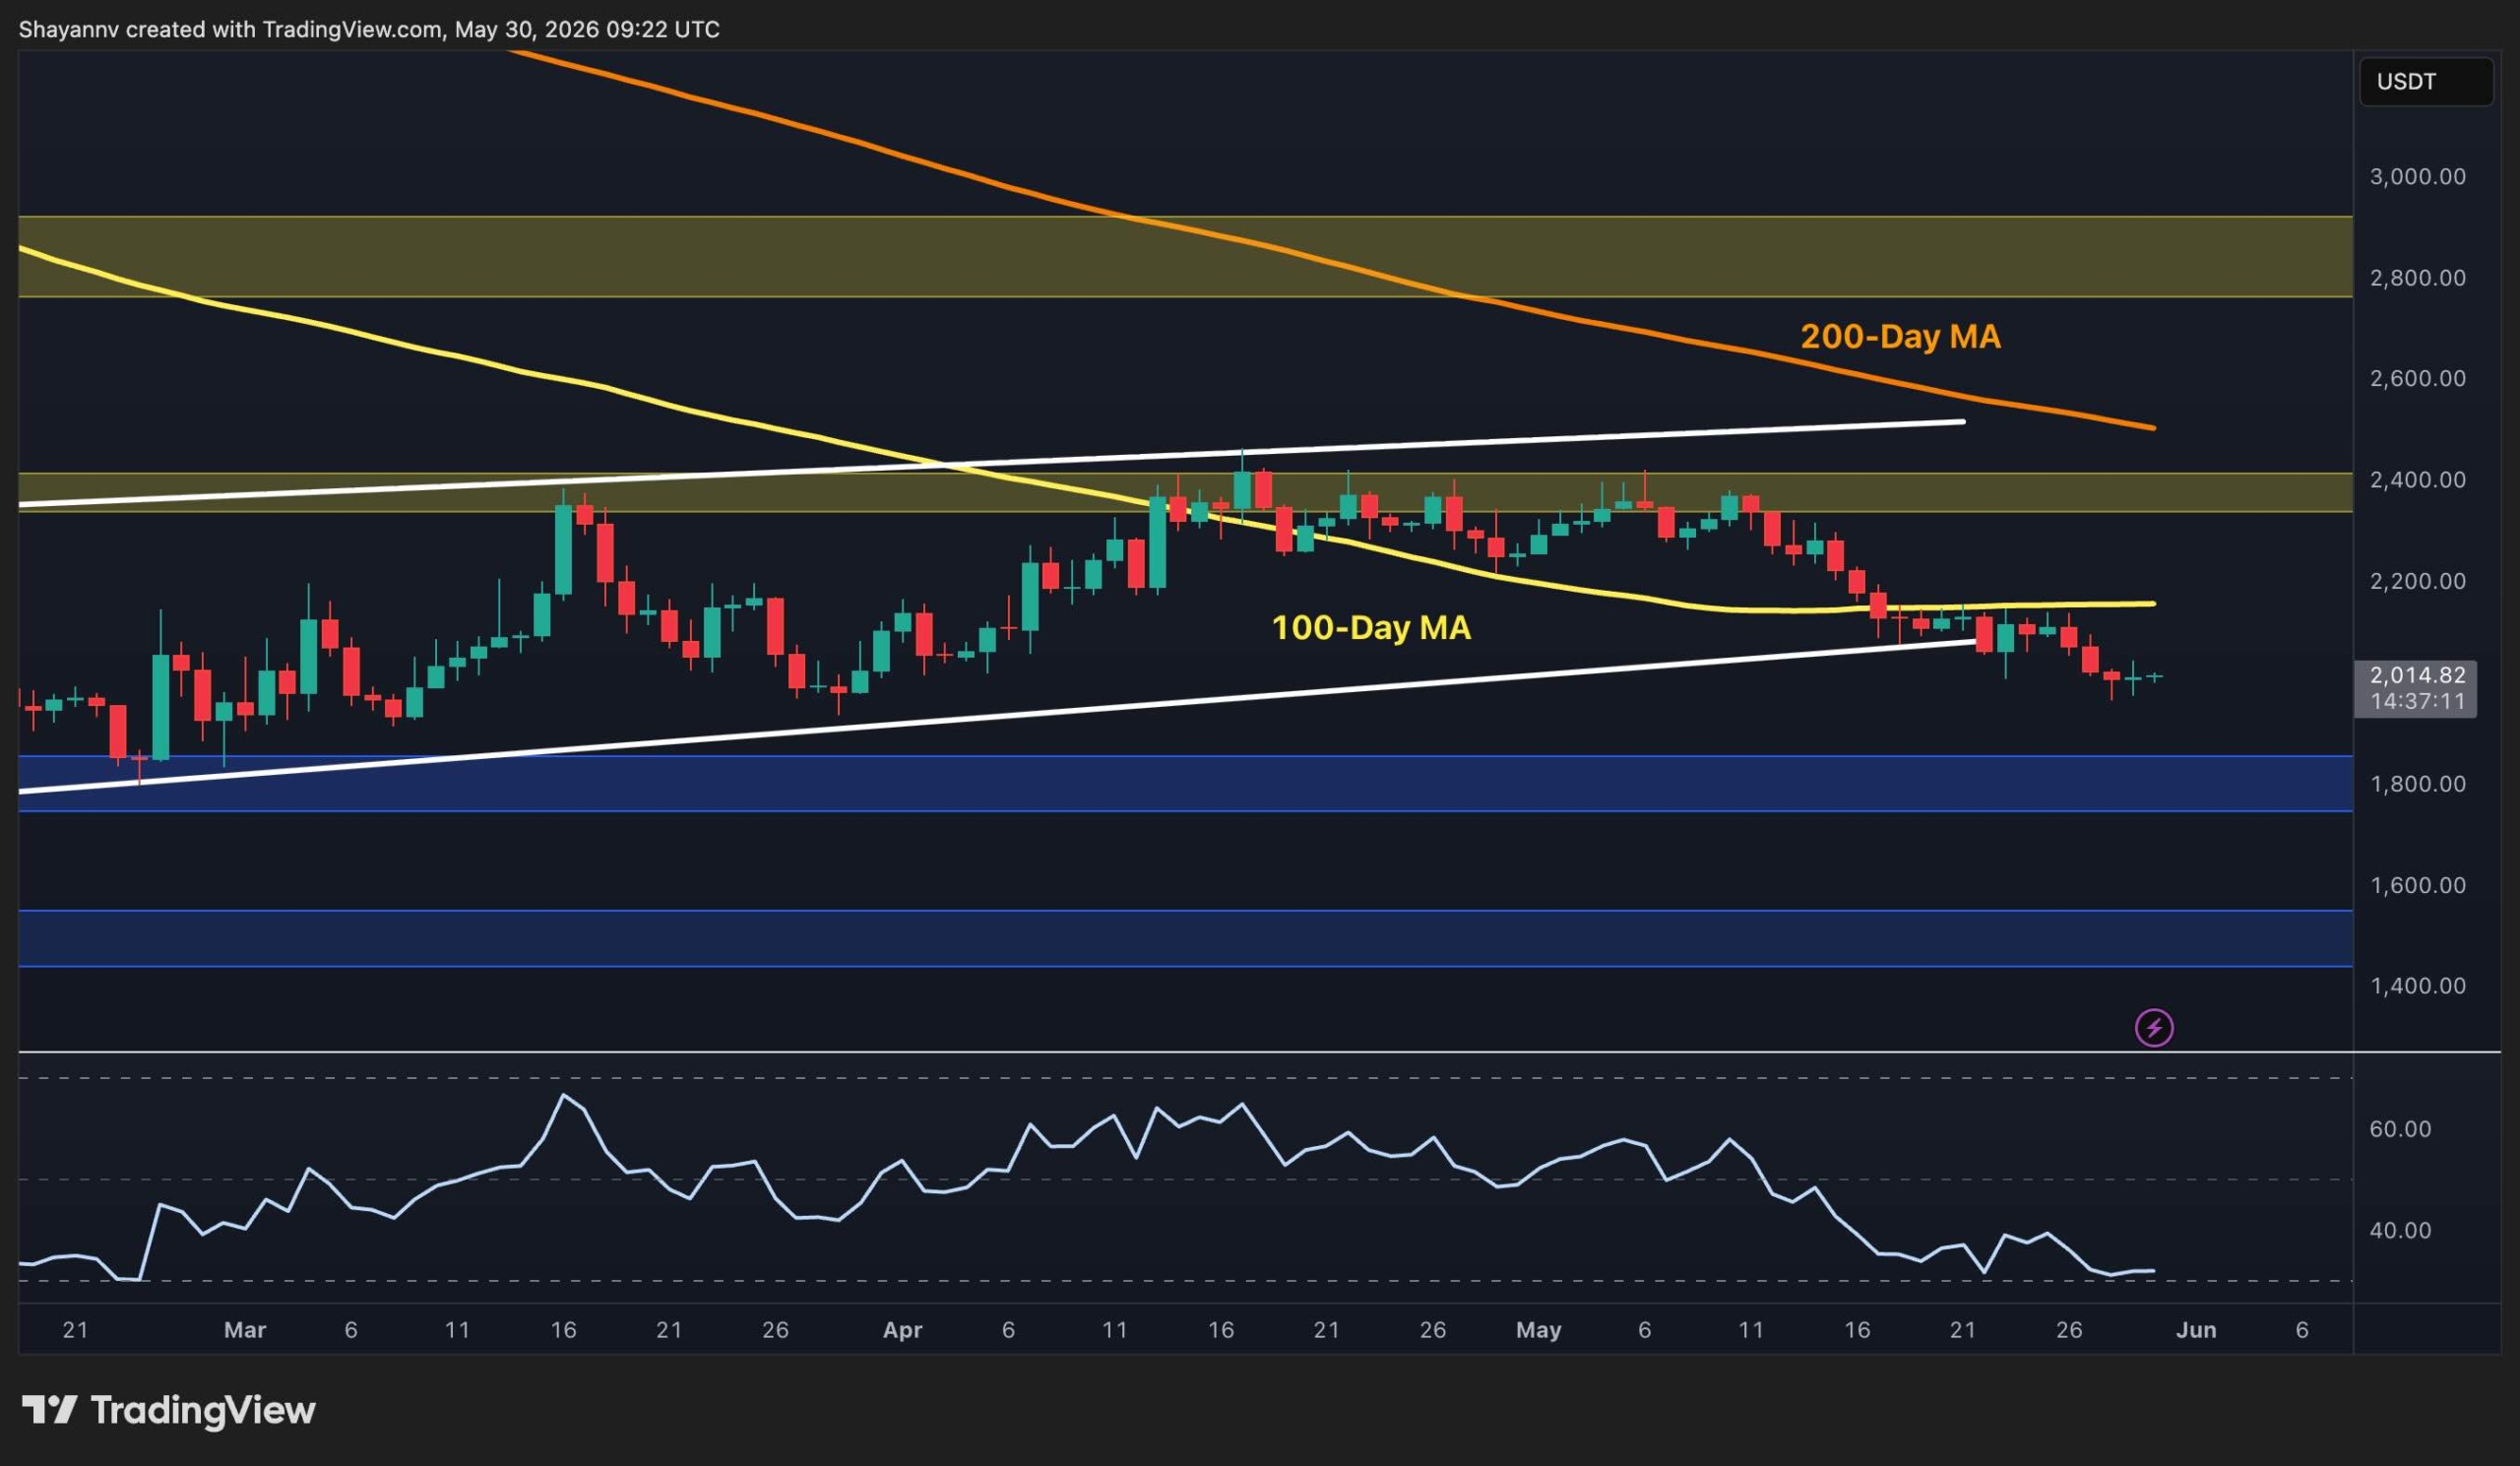
On the daily timeframe, ETH has decisively broken below the large ascending triangle structure that had developed between February and May. The move occurred after multiple rejections from the $2.4K resistance zone, which coincides with a major horizontal supply area and the former breakout region.
The bearish move has also pushed the price below the 100-day moving average, which is currently around $2.2K. More importantly, ETH remains significantly below the declining 200-day moving average near $2.5K. This indicates that the broader trend continues to favor sellers.
The recent rejection from the $2.4K zone confirms it as the primary resistance area. As long as ETH remains below this region, any recovery attempt may be viewed as a corrective bounce rather than a trend reversal.
On the downside, the next major support lies around the $1.8K zone, highlighted by the blue demand area and the February swing low. A daily close below the current $2K psychological support could increase the probability of a move toward that region.
Momentum indicators also remain weak. The RSI is hovering near oversold territory, which reflects persistent bearish momentum despite the recent stabilization around $2K.
ETH/USDT 4-Hour Chart
The 4-hour chart presents a clear descending channel that has guided price action lower throughout May. ETH has been moving toward the lower boundary of the channel again after failing to sustain any meaningful recovery from the mid-range resistance area.
The price is currently trading around $2K, which is a significant demand zone for the market. This area has produced a modest reaction so far, but buyers have yet to generate a convincing reversal signal.
The first resistance level is the descending channel’s upper boundary and the horizontal supply zone, which sits around $2.15K. Above that, the major resistance remains at $2.25K, followed by the upper supply zone near $2.4K.
A breakout above the descending channel could trigger a short-term relief rally toward the $2.15K and $2.25K regions. However, as long as the channel structure remains intact, the path of least resistance appears tilted to the downside.
Conversely, losing the $2K support zone would expose the channel’s lower extension and increase the likelihood of a deeper correction toward the $1.8K area identified on the daily chart.

Sentiment Analysis
The Ethereum Taker Buy Sell Ratio offers additional insight into current market sentiment. This metric measures the balance between aggressive buyers and aggressive sellers across exchanges. Readings above 1 indicate buyer dominance, while values below 1 suggest that market sell orders are outweighing buy orders.
The chart shows a persistent decline in the ratio over recent months, with the metric currently near 0.98 and below the neutral 1.0 threshold. This indicates that sellers continue to dominate order flow despite ETH’s prolonged correction.
For a sustainable recovery to develop, traders would likely need to see the Taker Buy Sell Ratio reclaim and hold above 1. Until that occurs, order flow suggests that bullish momentum remains limited and that rallies may continue to face significant selling pressure.

게시물 Ethereum Price Analysis: ETH Risks Deeper Drop as $2K Support Comes Under Pressure 에 처음 등장 크립토포테이토.


답글 남기기