
Bitcoin is trading around $76k as April draws to a close. It is sitting at one of the most technically loaded junctures of its entire corrective phase. After clawing back from the February low near $60k, BTC has quietly rebuilt momentum through the mid-$70ks, and with whale-sized spot accumulation now clustering at current levels, the market is asking a pointed question: is the correction that defined Q1 2026 finally over?
Bitcoin Price Analysis: The Daily Chart
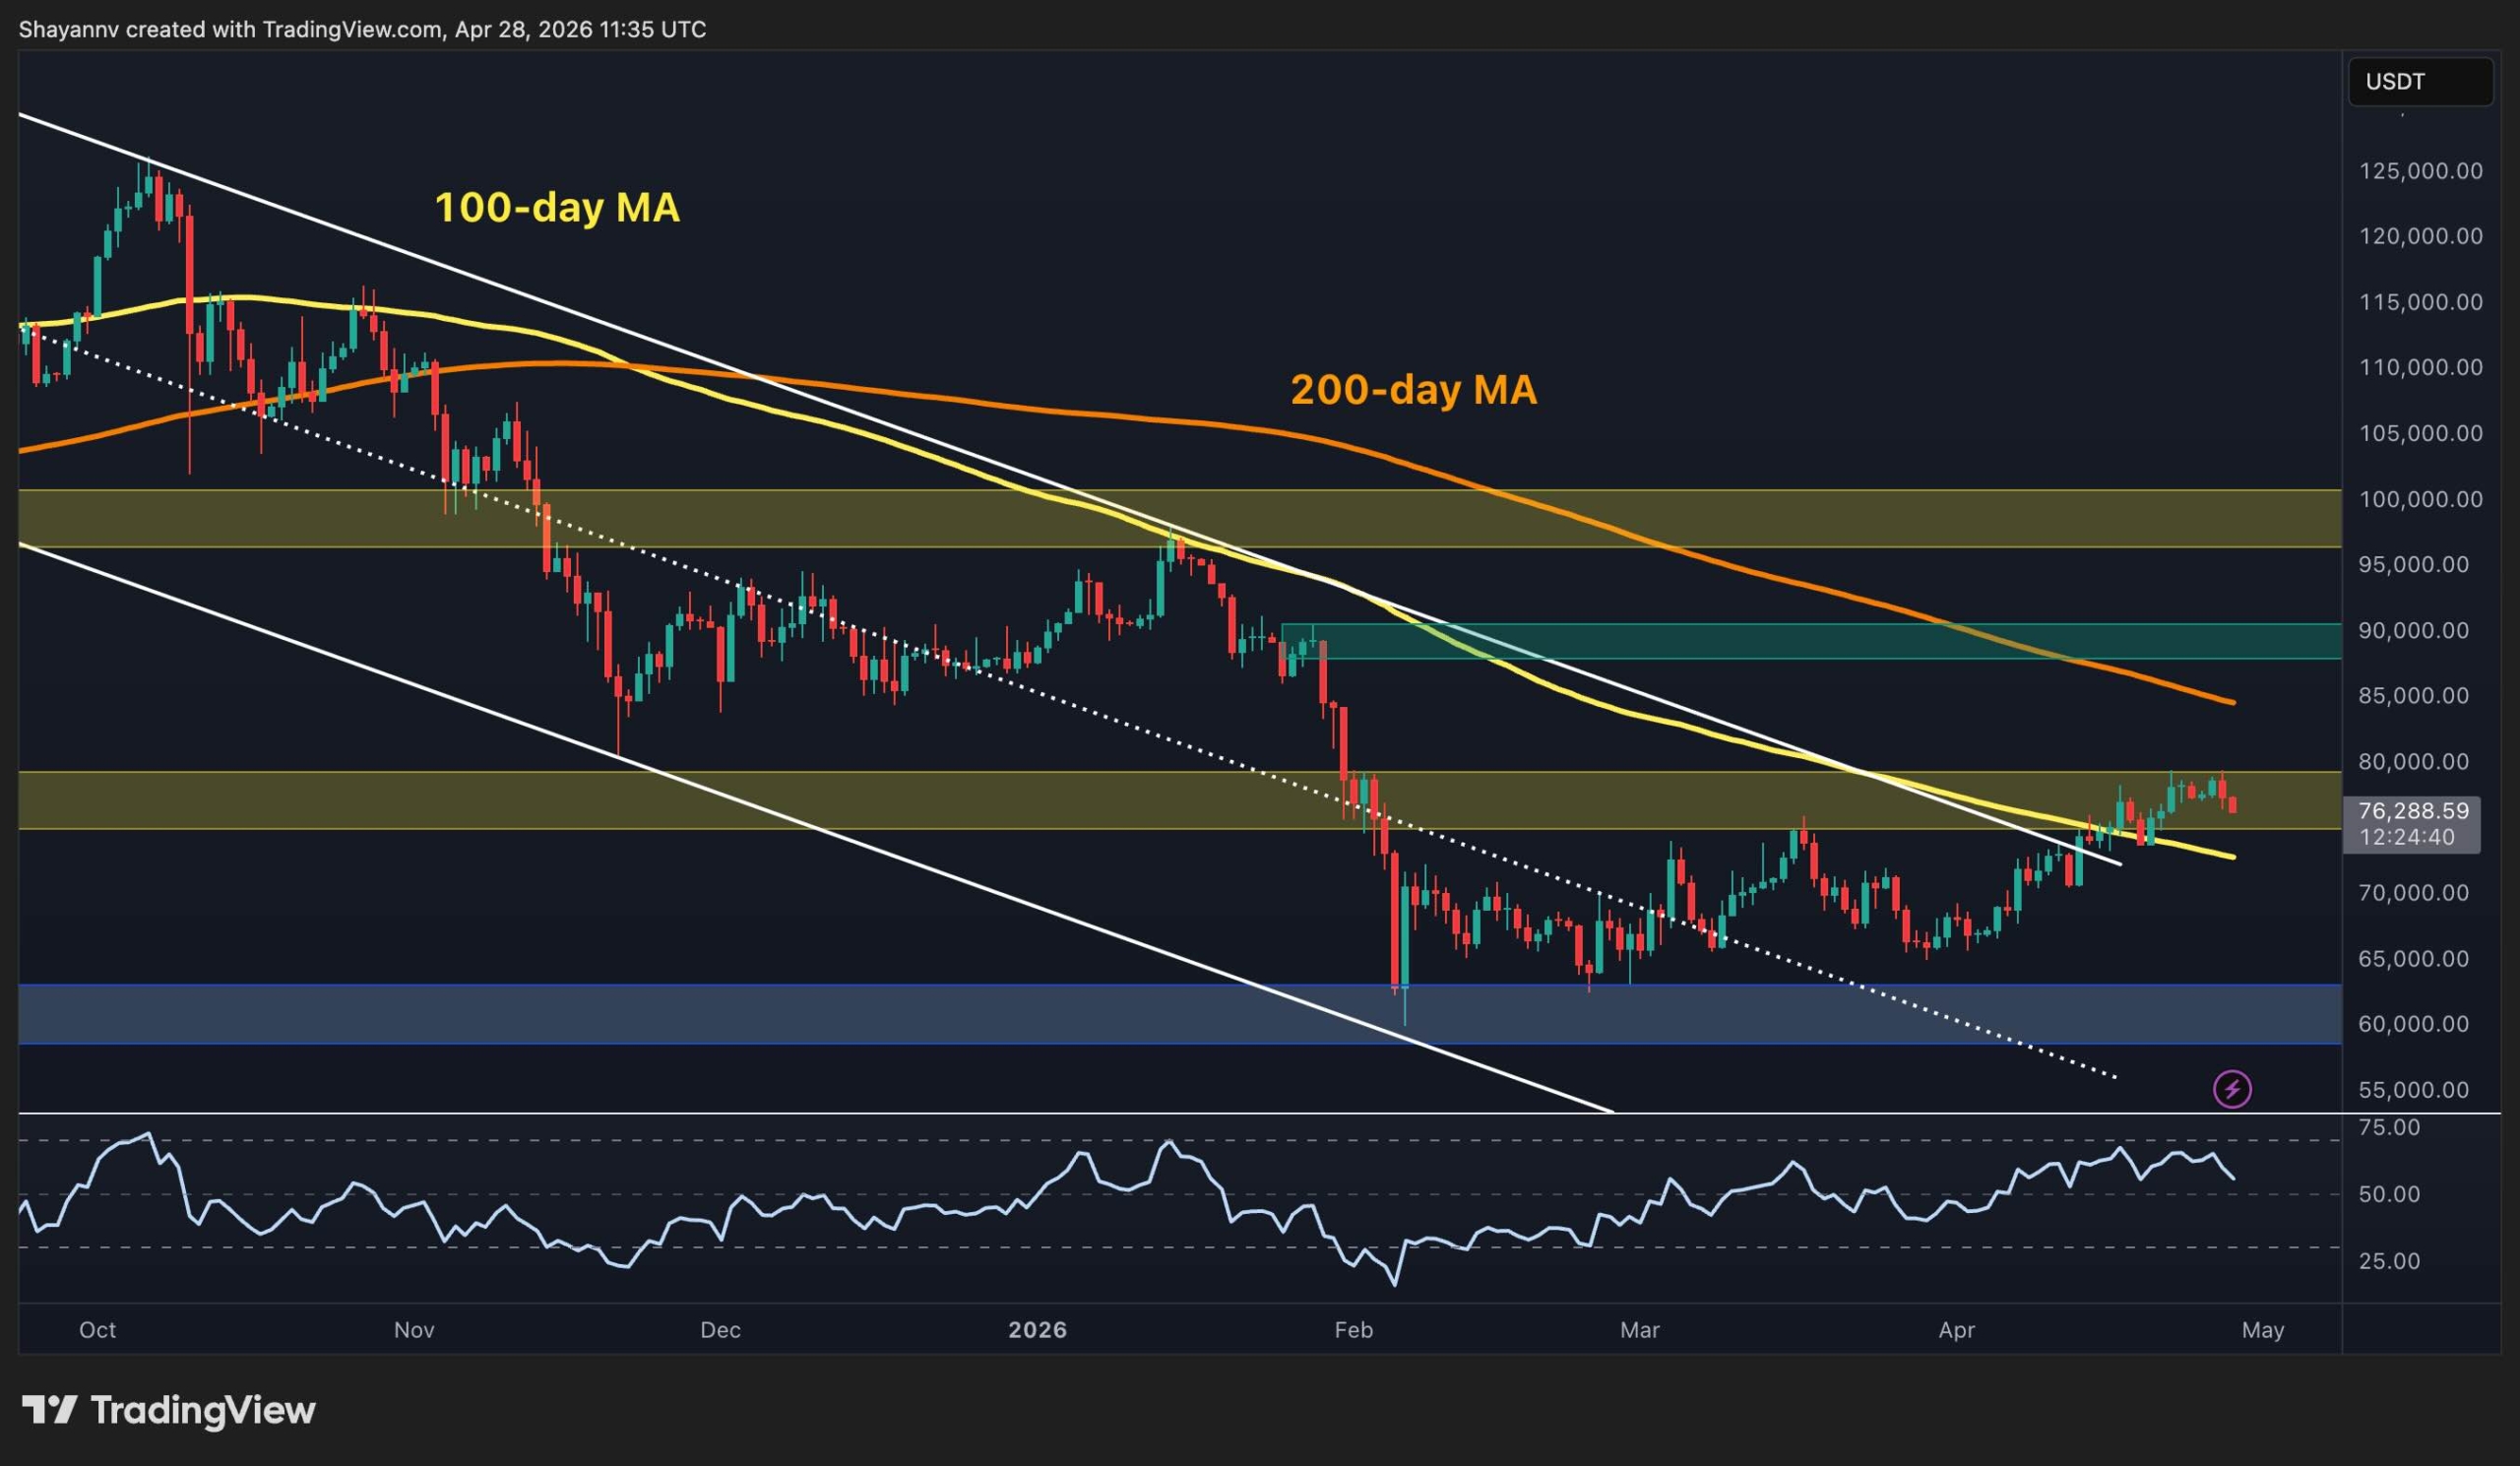
On the daily timeframe, Bitcoin has broken above the upper boundary of the descending channel that has been in place since the cycle peak above $120k in late 2025. The declining 100-day moving average, sitting around $72k–$73k, has also been broken, making a confluence of two major support elements below the current price. The RSI has also been hovering above 50 but is yet to show an overbought signal, suggesting bullish momentum is gradually building.
A clean daily close above the key $80k resistance level is the structural requirement for the market to shift the bias. The 200-day moving average declining around $85k represents the next major overhead barrier should the breakout materialize. Yet, a rejection from the $80k level and a daily close below $72k would put the ascending structure at risk and refocus attention on the $60k–$62k demand zone.
BTC/USDT 4-Hour Chart
On the 4-hour chart, the larger ascending channel that formed off the February low near $60k remains structurally intact. However, the sharp rally leg that drove the asset to nearly $80k has visibly stalled after testing and getting rejected from the upper boundary of the channel. The RSI on this timeframe has also dropped below 50 and is pointing to a potential short-term momentum shift.
The blue trendline representing the steeper inner rally structure has now been broken to the downside, which could lead to a deeper correction toward the $74k and even the $70k level if demand fails to overturn the trend. On the other hand, a clean bounce and reclaim of $80k could invalidate all the bearish scenarios and begin a strong recovery phase for Bitcoin on all timeframes.

Sentiment Analysis
The spot average order size data from CryptoQuant presents one of the more compelling on-chain developments of this cycle. Large whale orders have been clustering in the $60k–$80k range with a density not seen since the 2024 re-accumulation phase around the same price levels. These are large spot market participants absorbing supply at current prices, not leveraged traders chasing momentum, which historically carries more structural weight.
What makes the signal particularly notable is the context. Whales are accumulating not into a breakout, but into resistance, which is precisely the behavior seen at prior cycle inflection points.
Retail participation is also present, but it is secondary to the institutional-scale order flow dominating the chart. If this accumulation continues and the technical resistance level at $80k eventually yields, the on-chain picture will have provided an early signal that most price-only analyses would have missed.

게시물 Bitcoin Price Analysis: What Does the $80K Rejection Mean for BTC’s Short-Term Future? 에 처음 등장 크립토포테이토.


답글 남기기