
Bitcoin continues to trade under pressure after losing the critical $75K-$76K support zone, while broader market sentiment remains cautious amid weakening ETF inflows and deteriorating technical structure.
However, BTC is now approaching an important confluence of technical supports around $70K-$72K, where both trendline support and the 100-day MA could provide temporary relief for the market.
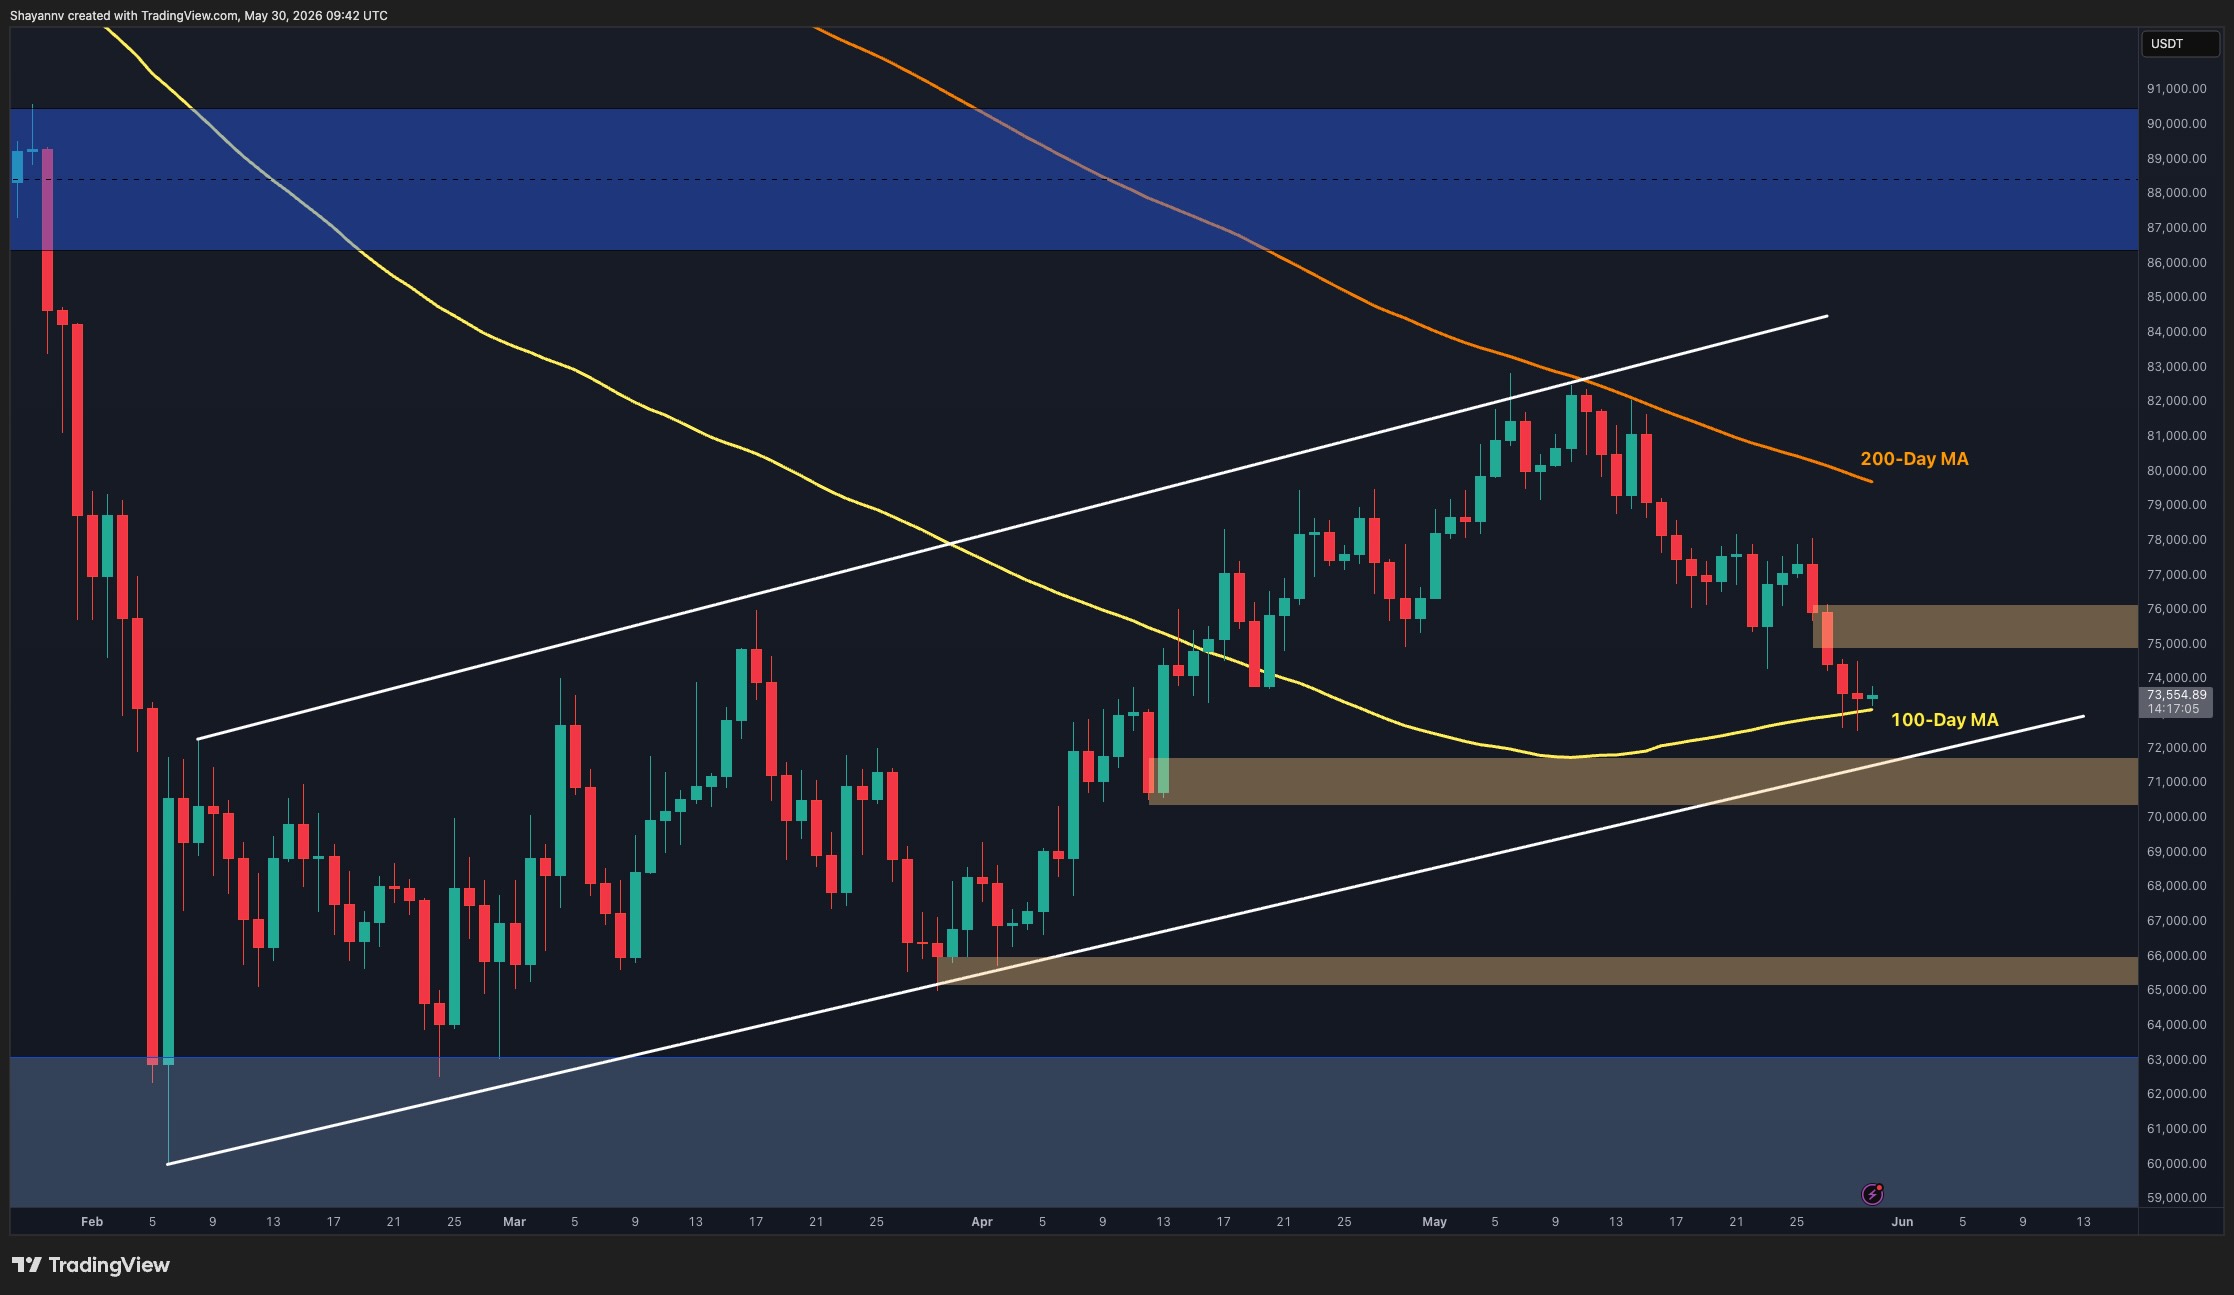
Bitcoin Price Analysis: The Daily Chart
On the daily timeframe, Bitcoin has officially broken below the key $75K-$76K support region, which previously acted as an important decision point for the market. The breakdown confirms bearish continuation after repeated failures to reclaim the descending 200-day MA near $80K-$81K.
Currently, the price is approaching a major support confluence around $70K-$72K. This region aligns with the ascending lower boundary of the broader structure, the 100-day MA around $73K, and a significant historical order block visible on the chart. Such overlapping supports often increase the probability of at least a short-term reaction or relief bounce.
If buyers manage to defend the $70K-$72K range, Bitcoin could attempt a corrective recovery back toward the broken $75K-$76K resistance zone. However, failure to hold this area may open the path toward deeper supports around $65K-$66K and potentially the broader $60K-$63K demand region.
For now, the overall market structure remains bearish unless BTC reclaims the $75K-$76K zone and stabilizes above it.
BTC/USDT 4-Hour Chart
The 4-hour chart reflects accelerating bearish momentum following the recent breakdown below the consolidation structure near $75K-$76K. Sellers remain in control, while lower highs and persistent rejection candles continue to dominate the short-term trend.
Nevertheless, Bitcoin is now entering a critical order block between $70K and $72K. This zone has historically attracted significant demand and currently overlaps with the rising trendline support shown on the chart. The market reaction here will likely determine the next major move.
A short-term bullish pullback remains possible if buyers step in around this support cluster. In that scenario, BTC could revisit the $74K-$76K region as a corrective rebound. However, if the current support fails to hold, bearish momentum could accelerate rapidly toward the $65K-$66K liquidity zone.
Therefore, the $70K-$72K area represents the most important short-term battlefield between buyers and sellers.

Sentiment Analysis
The ETF cumulative flow chart reveals an important divergence developing in the market. Despite Bitcoin attempting multiple recoveries during recent months, cumulative ETF inflows have started flattening and have recently turned weaker alongside the latest correction.
This behavior suggests that institutional demand has cooled considerably compared to previous accumulation phases. The slowdown in spot Bitcoin ETF inflows indicates reduced aggressive buying from large market participants, which partly explains BTC’s inability to sustain rallies above the $80K-$82K region.
More importantly, recent price weakness has occurred while cumulative ETF flows remain relatively stable rather than aggressively expanding higher. This signals a lack of fresh capital entering the market at current levels.
Historically, strong bullish continuation phases in Bitcoin have usually been accompanied by accelerating ETF inflows. The absence of that dynamic increases the likelihood that the current market will remain corrective in the short term.
Still, if Bitcoin stabilizes around the $70K-$72K support region and ETF flows begin strengthening again, the market could regain momentum later. Until then, weakening institutional demand, combined with a bearish technical structure, keeps downside risks elevated despite the possibility of temporary relief rallies.

게시물 Bitcoin Price Analysis: BTC Eyes $70K-$72K Support Amid Market Weakness 에 처음 등장 크립토포테이토.


답글 남기기