

Bitcoin has entered a consolidation phase after reaching $124,500 earlier this month and retracing below the $115,000 mark. The sharp move higher followed by weeks of sideways action has left the market in a state of uncertainty, with traders watching closely for the next decisive move. For many analysts, this consolidation is not a sign of weakness but rather a natural pause before the next leg higher.
A push above the all-time high would be the clearest confirmation that the next wave of growth has begun. Momentum, however, remains dependent on whether buyers can reclaim lost ground and sustain pressure against resistance levels. Despite short-term caution, onchain signals suggest the broader cycle is still building toward expansion.
According to key data shared by CryptoQuant, the Bitcoin Composite Probability points to an early accumulation phase. Historically, such phases occur before major breakouts, when patient investors quietly build positions while price consolidates. This indicator aligns with the idea that the market is resetting before another surge.
Bitcoin Market Structure Points To Early Accumulation
According to top analyst Axel Adler, Bitcoin’s current cycle can be broken down into clear phases of accumulation and distribution. The index highlights two major accumulation points: the first in March 2023, when Bitcoin traded around $22,000, and the second in August–September 2023, near the $29,000 level. These zones marked periods when long-term holders and new entrants quietly built positions before the next leg upward.
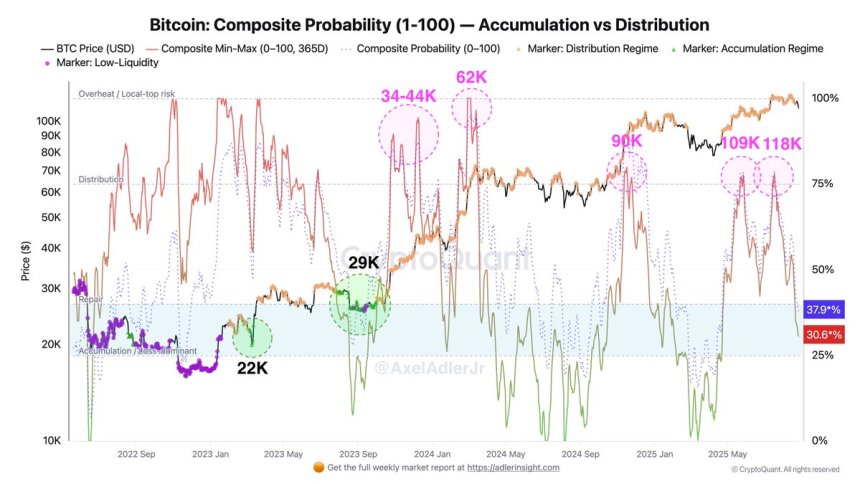
Following these accumulation phases, Adler identifies five distribution waves where profit-taking dominated: first between $34,000 and $44,000, then at $62,000, followed by $90,000, $109,000, and most recently at $118,000. Each wave represented a step higher in the market structure, but also a point where sellers gradually released supply back into the market.
Currently, CryptoQuant’s composite places Bitcoin at a Probability of 38% with a Min-Max of 31%, which he defines as the “repair zone.” This phase, also referred to as digestion or base formation, reflects early accumulation without yet confirming an upward reversal. In other words, while the groundwork for a new rally may be forming, conviction from buyers has not fully returned.
For investors, this repair zone carries important implications. Historically, such phases have preceded new bullish waves, offering opportunities for those willing to accumulate before momentum shifts. As Bitcoin consolidates below its highs, Adler suggests that the market may be quietly preparing for continuation — a reminder that consolidation often sets the stage for the next decisive move.
Testing Pivotal Level As Downtrend Extends
Bitcoin is trading around $109,800 after another sharp drop, reinforcing the selling pressure that has weighed on price action throughout August. The 4-hour chart highlights BTC’s continued struggle to regain momentum following repeated rejections near the $123,000 resistance zone. Each attempt to push higher has been met with heavy supply, leaving the market to trend lower in a series of lower highs and lower lows.

Currently, BTC sits just above the $110,000 mark, a level acting as short-term support. However, the broader structure remains bearish, with price trading below the 50-day ($112,725), 100-day ($115,023), and 200-day ($115,831) moving averages. These technical levels now serve as overhead resistance, further complicating the path for bulls to stage a meaningful recovery.
If Bitcoin fails to hold the $110,000 support, the next downside target lies near $108,000, with a deeper correction potentially extending toward $106,000. Conversely, a bounce from current levels would require reclaiming $112,000 to ease immediate pressure, while a decisive move above $115,000 would be essential to shift momentum back in favor of buyers.
Featured image from Dall-E, chart from TradingView












 한국어
한국어  English
  Română
  Eesti
Eesti  日本語
日本語  Русский
  Deutsch
  Español
  简体中文
简体中文  Français
  繁體中文
繁體中文  Português
  Italiano
  Polski
  Türkçe
  Nederlands
  Bahasa Indonesia
  Ελληνικά
  Українська
  Български
  Čeština
  Suomi
Suomi  Magyar
  Latviešu valoda
  Lietuvių kalba
  Norsk bokmål
  Slovenčina
  Slovenščina
  Svenska
답글 남기기