
Ethereum has continued its recovery from the June lows and is now approaching a major technical inflection point. While the recent rally has improved short-term sentiment, the asset is still trading beneath a confluence of long-term resistance levels.
Interestingly, the liquidation landscape aligns closely with these technical barriers, suggesting that ETH could first target overhead liquidity before the market decides whether a larger trend reversal is underway or another corrective leg lower remains ahead.
Ethereum Price Analysis: The Daily Chart
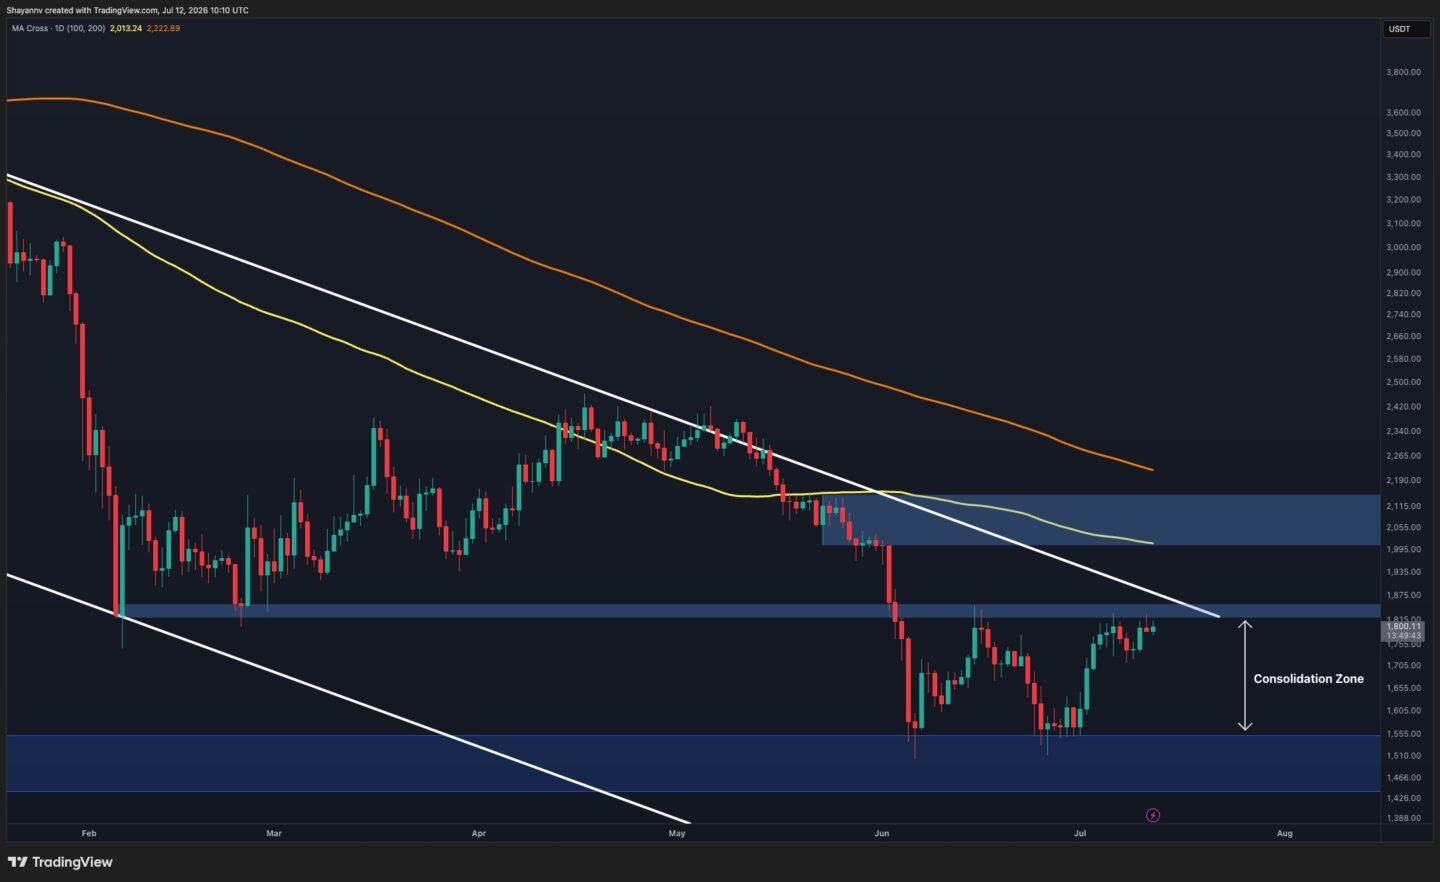
On the daily timeframe, ETH remains within a broader descending structure in place since the beginning of the year. It has recovered strongly from the major demand zone around $1.45K-$1.55K and is currently testing the key resistance region around $1.80K-$1.85K.
This area is particularly significant because it coincides with the descending trendline that has capped price action since May. The level also represents a major horizontal resistance that previously acted as support before the June breakdown.
Despite the recent strength, ETH remains below the 100-day and 200-day moving averages, both of which continue to trend lower. The 100-day MA is positioned around the $2K-$2.1K resistance zone, while the 200-day MA remains considerably higher near $2.2K, reinforcing the broader bearish market structure.
As long as ETH remains below the descending trendline and the $1.80K-$1.85K resistance zone, the current move can still be viewed as a recovery rally within a larger downtrend. A decisive breakout above this area would shift focus toward the next major resistance at $2K-$2.1K.
ETH/USDT 4-Hour Chart
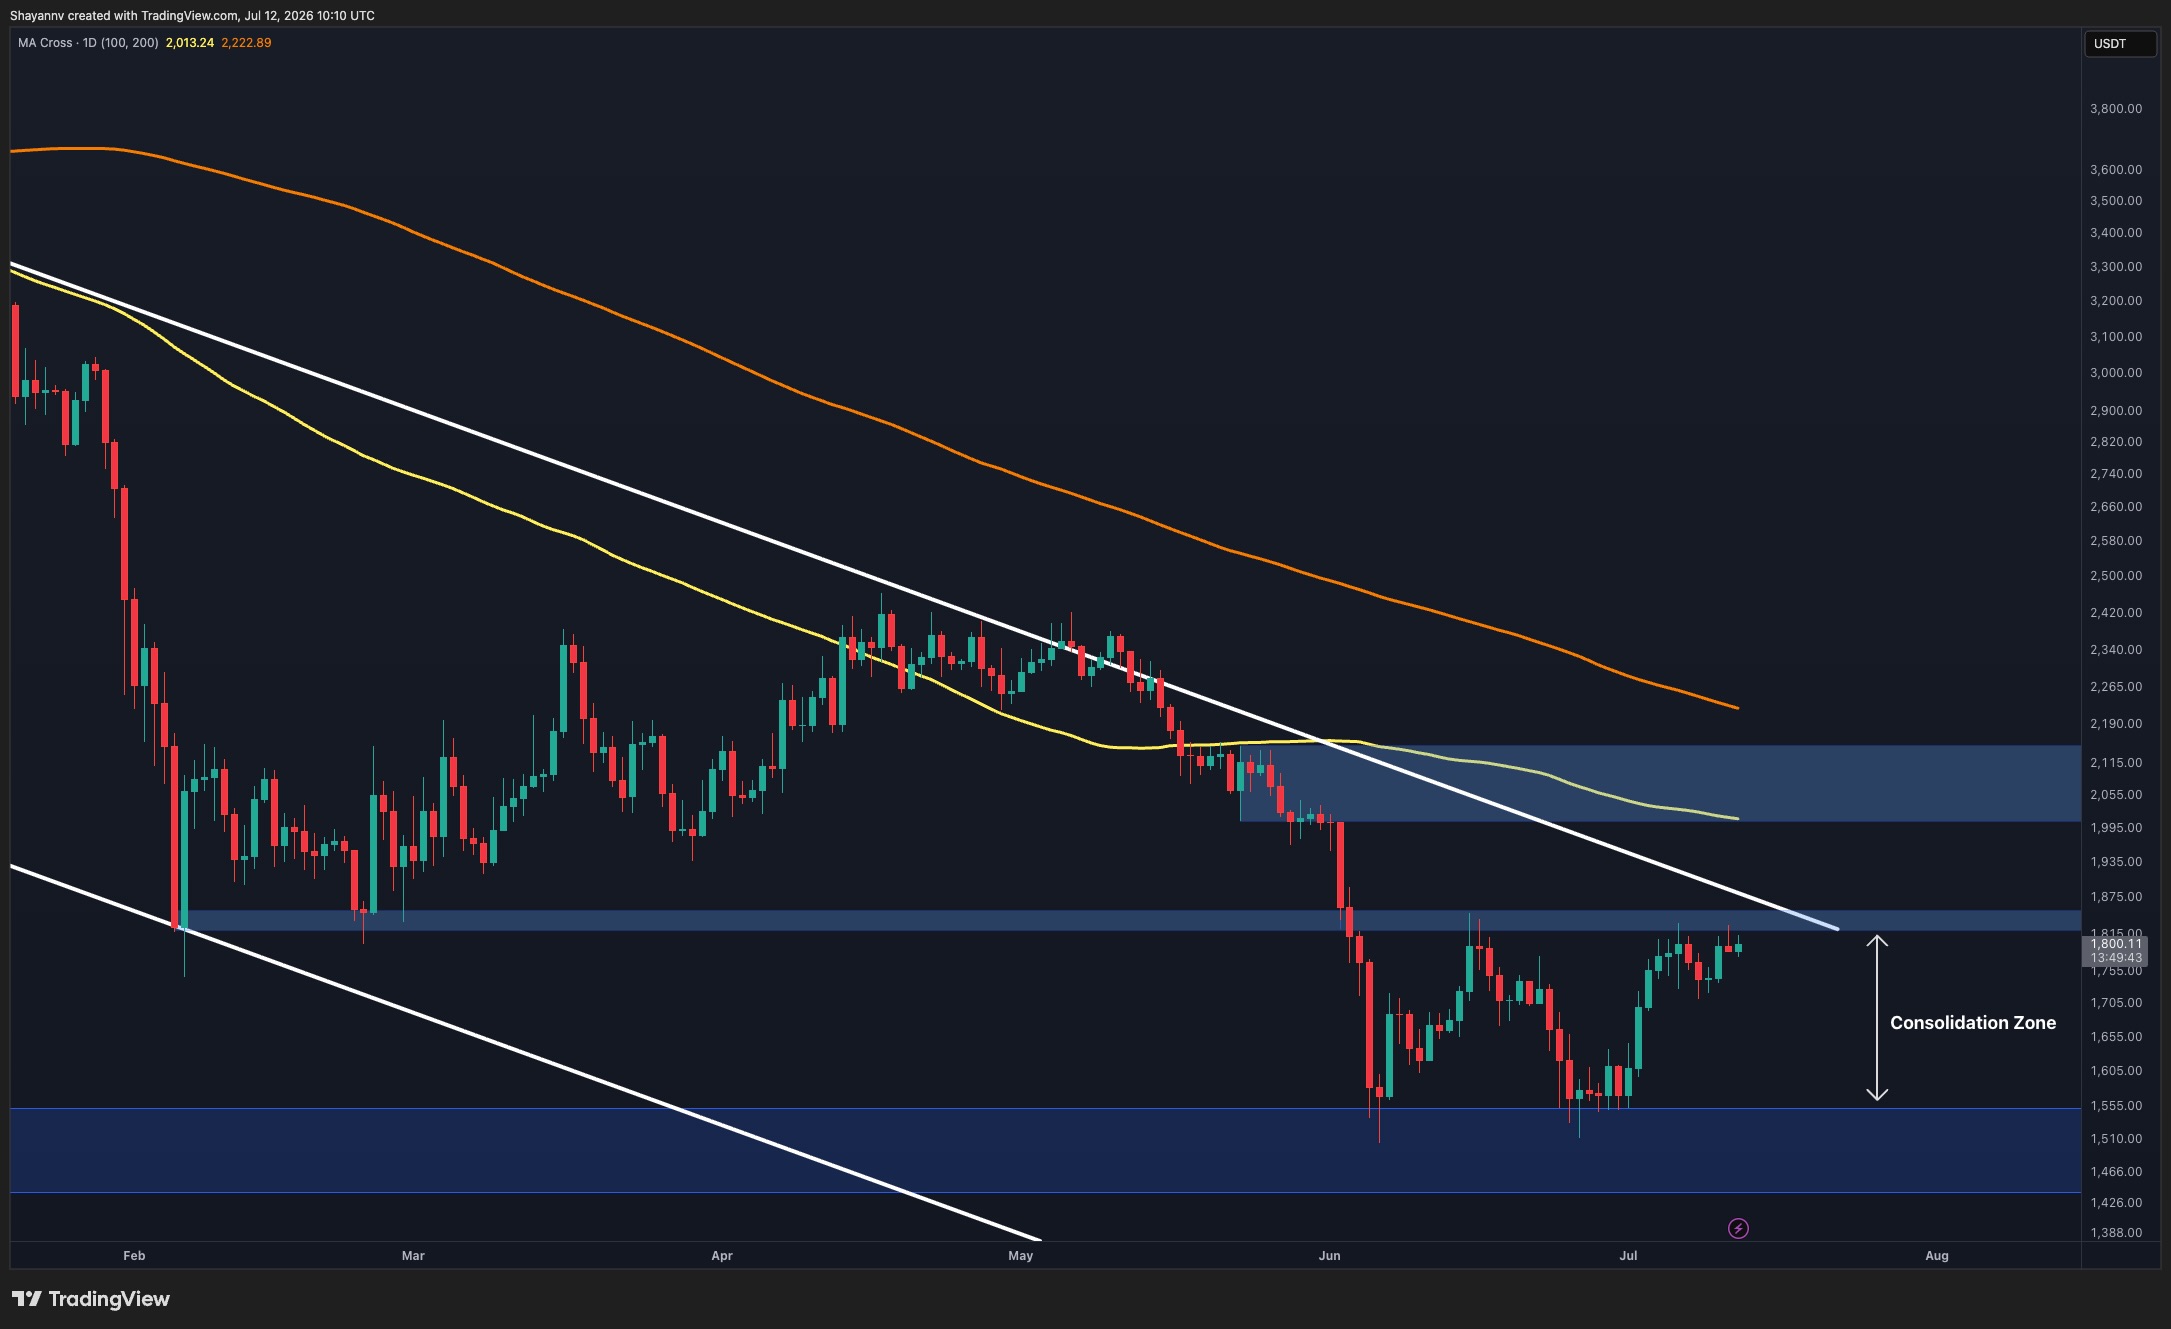
The 4-hour chart highlights a clear ascending structure that has developed since the late-June low. Price has respected the rising channel boundaries while forming higher highs and higher lows, reflecting improving short-term momentum.
The market has already reclaimed the $1.62K-$1.64K demand zone and subsequently established another support area around $1.72K-$1.74K. These zones have repeatedly attracted buyers during pullbacks and continue to define the short-term bullish structure.
However, the rally is now approaching the upper boundary of the channel and the major resistance band around $1.83K-$1.85K. This creates a natural area where profit-taking and seller activity could emerge.
From a structural perspective, ETH remains constructive above the $1.72K-$1.74K support region. Losing this level would be the first sign that bullish momentum is fading and could expose the lower channel boundary and the broader support zone around $1.55K.
Sentiment Analysis
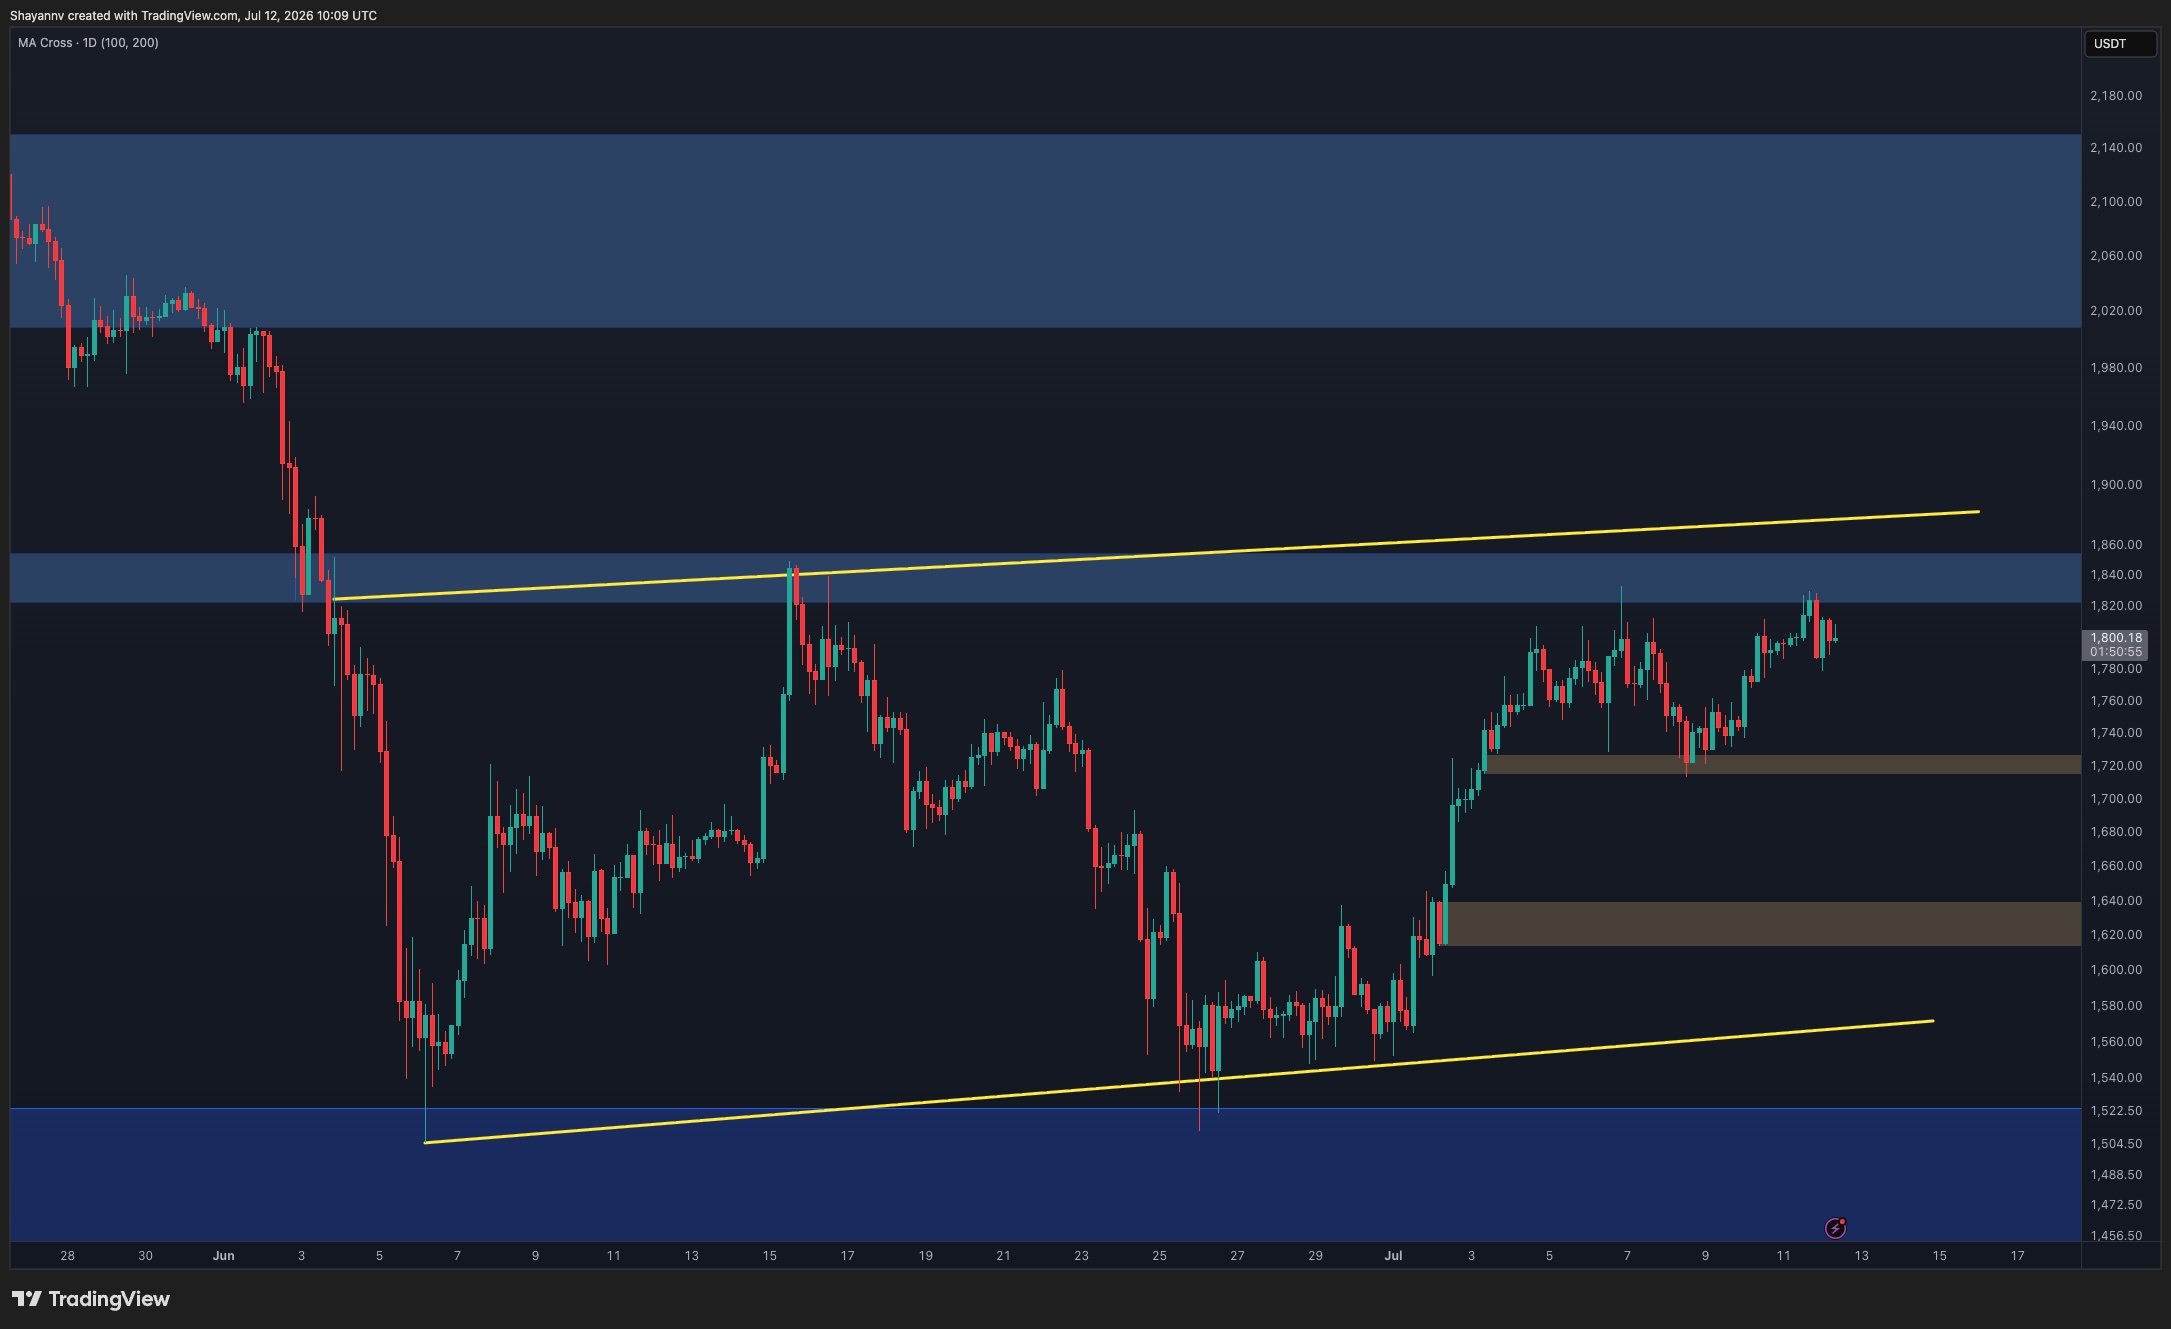
The Binance ETH/USDT liquidation heatmap provides an important clue regarding the next likely move.
The most significant concentration of short-side liquidity sits above the current market price, particularly within the $1.95K-$2.1K region. This cluster aligns remarkably well with the daily chart resistance zone, the 100-day moving average, and the broader supply area visible on the higher timeframe.
Meanwhile, substantial liquidity pools remain below the market around the $1.45K-$1.55K region, which corresponds closely with the major daily demand zone that has supported ETH throughout the recent recovery.
The alignment between the liquidation map and the technical structure suggests that the market may first be drawn toward the overhead liquidity cluster. A move into the $2K-$2.1K area would effectively sweep a large concentration of short liquidations while simultaneously testing one of the most important resistance zones on the chart.
The reaction at that region will likely determine the next major directional move. If buyers manage to reclaim the $2K-$2.1K resistance area and establish acceptance above it, the recovery could evolve into a broader bullish trend reversal. However, if the liquidity sweep is followed by strong selling pressure and rejection from resistance, ETH could enter another notable decline, potentially targeting the large liquidity pools resting beneath the market around the $1.45K-$1.55K support zone.
ポスト Ethereum Price Analysis: ETH Reaches Its Biggest Obstacle on the Road to $2K に初登場した。 クリプトポテト.












 日本語
日本語  English
  Română
  Eesti
Eesti  한국어
한국어  Русский
  Deutsch
  Español
  简体中文
简体中文  Français
  繁體中文
繁體中文  Português
  Italiano
  Polski
  Türkçe
  Nederlands
  Bahasa Indonesia
  Ελληνικά
  Українська
  Български
  Čeština
  Suomi
Suomi  Magyar
  Latviešu valoda
  Lietuvių kalba
  Norsk bokmål
  Slovenčina
  Slovenščina
  Svenska
コメントを残す