
Ethereum has staged a notable recovery after suffering a steep decline toward the $1.5K region. While the rebound has improved short-term sentiment, the broader structure remains bearish across higher timeframes, with ETH still trading below major moving averages and a long-term descending trendline. The coming sessions will likely determine whether this move evolves into a sustainable recovery or merely a relief rally within a larger downtrend.
Ethereum Price Analysis: The Daily Chart
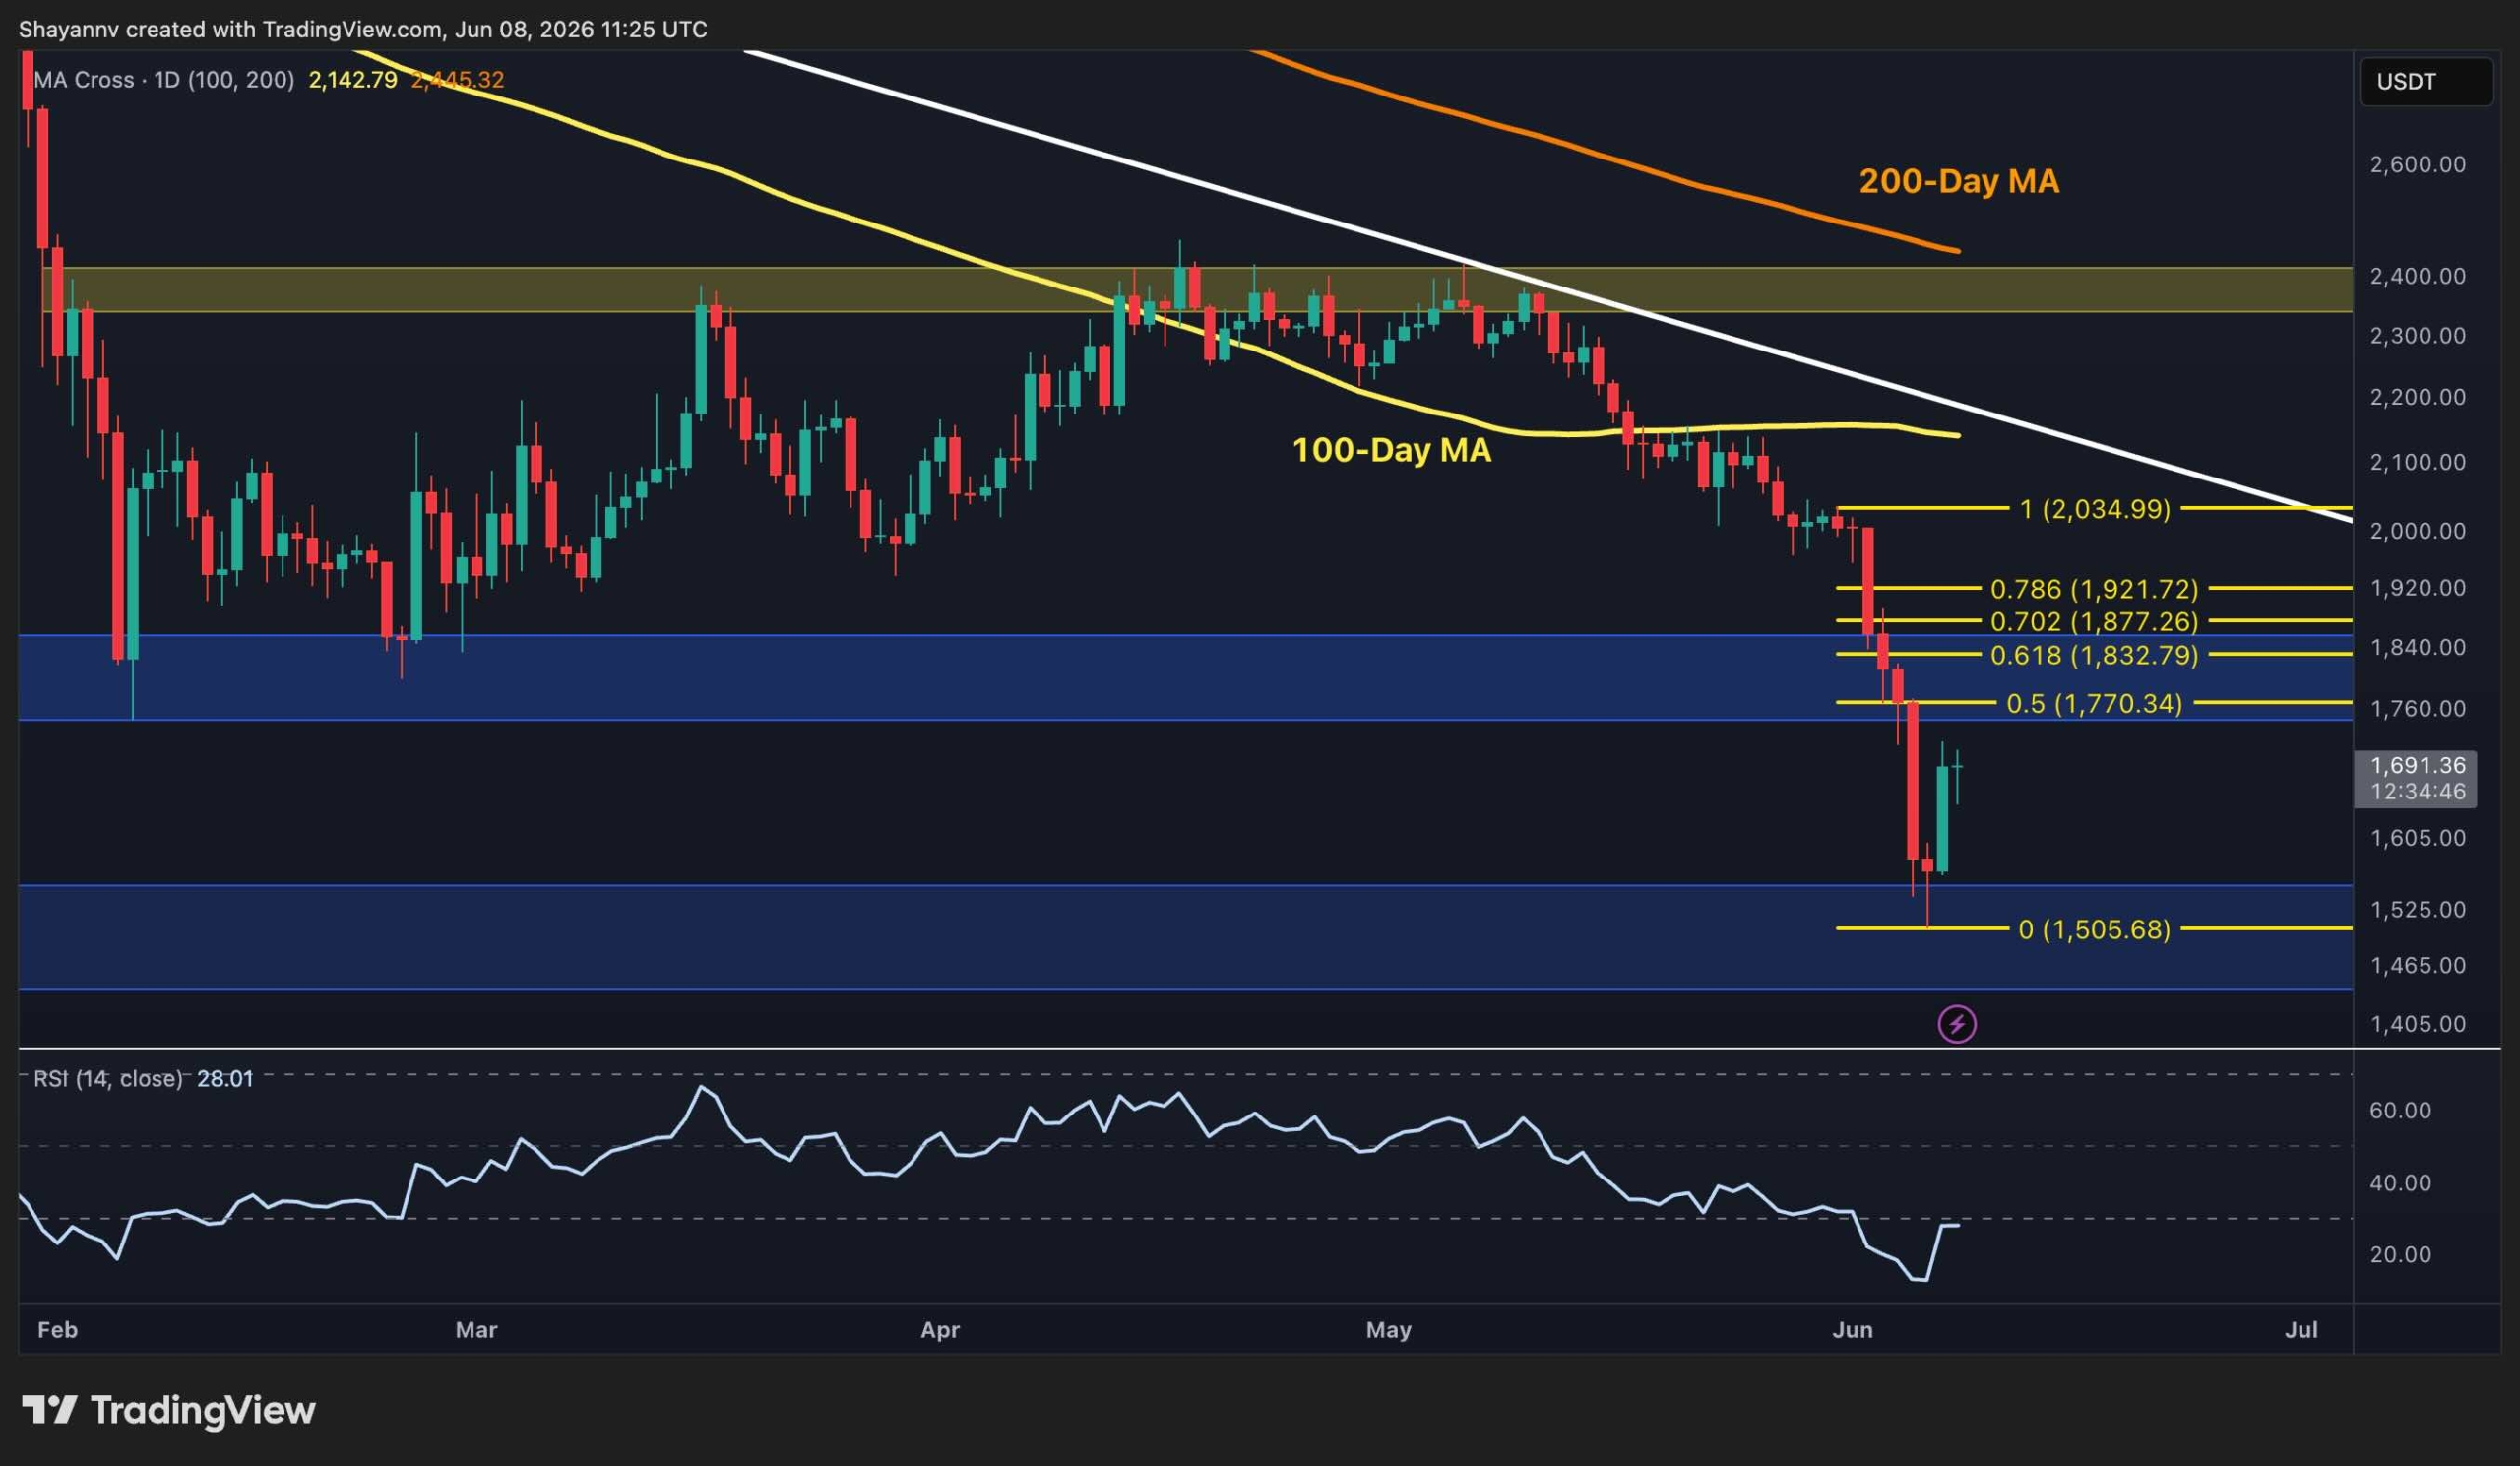
On the daily timeframe, ETH remains under significant technical pressure despite the recent bounce from the $1.5K support area. The price briefly swept below the major demand zone around $1.5K before attracting buyers and rebounding toward $1.7K.
The broader market structure continues to favor sellers. Ethereum is trading below both the 100-day moving average near $2.1K and the 200-day moving average around $2.4K. This indicates that the higher-timeframe trend remains firmly bearish. In addition, the long-term descending trendline extending from previous highs continues to cap upside attempts and reinforces the prevailing downtrend.
The last leg of the selloff established a clear bearish impulse, with the Fibonacci retracement levels now highlighting potential recovery targets where sellers may re-enter the market. The first notable resistance lies at the 0.5 retracement level around $1.77K, followed by the 0.618 level at $1.83K, and the 0.786 retracement near $1.92K.
These levels are expected to serve as potential rejection zones if sellers remain in control of the broader trend. Therefore, while the ongoing rebound could extend toward this resistance cluster, traders should closely monitor price action around these areas, as they may become attractive regions for renewed supply and another bearish continuation attempt.
ETH/USDT 4-Hour Chart
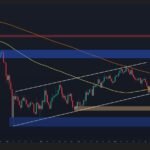
The lower timeframe reveals a more constructive short-term picture. After capitulating into the $1.5K low, ETH formed a strong reactionary bounce and is currently getting support from the bullish fair value gap positioned around the $1.64K region.
This area is acting as an immediate demand zone and could provide support if a short-term pullback occurs. The recovery has also pushed RSI above the midpoint level, indicating improving momentum after the aggressive selloff.
However, the market remains below the key Fibonacci resistance cluster between $1.75K and $1.85K. This range now represents the primary liquidity zone where sellers may attempt to regain control. A continuation toward that area appears possible as long as ETH remains above the bullish fair value gap.
If buyers can maintain momentum and reclaim the $1.77K level, a larger short-squeeze toward $1.83K and $1.92K could develop. On the other hand, losing the fair value gap support around $1.64K would weaken the recovery structure and increase the probability of another test of the $1.5K low.

Sentiment Analysis
The Coinbase Premium Index provides additional insight into current market sentiment. The metric measures the price difference between Coinbase and offshore exchanges and is often used as a proxy for U.S. institutional demand.
The chart shows that the Coinbase Premium Index has spent most of the recent period in negative territory, coinciding with Ethereum’s prolonged decline from $5K toward the current cycle lows. The latest reading remains below zero at approximately -0.04, indicating that U.S. spot demand is still relatively weak.
That said, the metric has rebounded sharply from recent extreme negative readings near -0.15. Historically, such deeply negative premium levels often emerge during periods of capitulation and heavy selling pressure. The recent recovery suggests that selling intensity may be easing, even if strong accumulation has not yet returned.
For a more durable bullish reversal, the Coinbase Premium Index would ideally need to reclaim positive territory and remain consistently above zero. Until then, the data suggests that Ethereum’s current bounce is being driven more by relief from oversold conditions than by clear evidence of aggressive institutional accumulation.

ポスト Ethereum Price Analysis: Can ETH Maintain Its Recovery? The Next Trading Days Will Be Crucial に初登場した。 クリプトポテト.


コメントを残す