

Ethereum is once again at the center of market attention, trading at critical levels after a volatile stretch marked by uncertainty and rapid swings. The second-largest cryptocurrency has reclaimed the $4,400 level, signaling renewed bullish momentum. Investors are closely watching whether ETH can extend this recovery into a sustained breakout, with many expecting that a decisive move higher could open the path toward testing yearly highs.
Still, not all market voices are aligned. While momentum appears to favor the bulls, several analysts warn of risks that could challenge Ethereum’s upward trajectory. Concerns range from declining liquidity in certain segments of the market to profit-taking by large holders, which could weigh on price action if upside fails to hold.
Adding to the discussion, top analyst Axel Adler has shared insights comparing Bitcoin and Ethereum’s performance this year. His data reveals that while both assets have taken different paths in their respective rallies, they ultimately point to the same destination: a continuation of the broader bullish cycle. This perspective has fueled optimism that ETH’s recovery may not just be a short-term bounce but part of a larger, ongoing trend that aligns with Bitcoin’s strength.
Ethereum Catches Up to Bitcoin
l Adler highlights an important development in Ethereum’s market trajectory. Over the last quarter, Ethereum has nearly matched Bitcoin in annual performance, a sign of growing strength for the world’s second-largest cryptocurrency.
In his latest analysis, Adler shared a chart comparing the one-year performance of BTC and ETH, measured from October 2024 to today. The data reveals that both assets have surged over 90% in the past year, despite taking different routes to arrive at similar results.

Bitcoin has largely been the driver of crypto market momentum in 2025, with ETFs, institutional inflows, and macroeconomic narratives fueling demand. Ethereum, on the other hand, faced periods of underperformance earlier this year, weighed down by high volatility and concerns around liquidity. However, its recent resurgence has narrowed the gap and demonstrated that ETH remains firmly aligned with the broader bullish cycle.
Adler’s findings suggest that ETH’s current positioning is not just a coincidence, but a reflection of strengthening fundamentals and adoption. With Ethereum continuing to dominate in DeFi, stablecoin issuance, and tokenization initiatives, the recovery in performance compared to Bitcoin indicates growing confidence from both retail and institutional investors.
This convergence between BTC and ETH performance reinforces the view that the two assets, while distinct in their use cases, are moving in tandem toward the same broader trend: a bullish cycle that could see both testing new all-time highs in the coming months.
ETH Testing Pivotal Resistance
Ethereum (ETH) is trading at $4,483, showing signs of strength after reclaiming the $4,400 level. The 8-hour chart highlights a decisive bounce from sub-$4,000 levels last week, with buyers stepping in aggressively to defend support around $3,900. This recovery has pushed ETH back above its 50-day and 100-day moving averages, a positive technical signal that reinforces short-term bullish momentum.
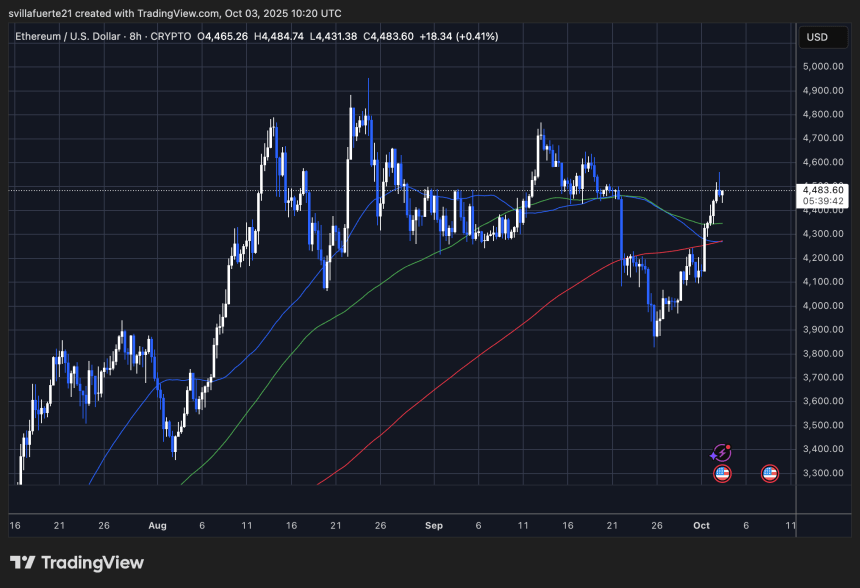
The next major resistance lies around the $4,500–$4,600 zone, an area that has repeatedly capped upside attempts since August. A clean breakout above this band could trigger a move toward the previous local highs near $4,800, and potentially open the path toward $5,000. On the downside, $4,300 now acts as immediate support, followed by the $4,000 psychological level.
Volume has been supportive during this recent rally, signaling strong demand. However, ETH must maintain momentum above its moving averages to avoid falling back into the consolidation range. The chart structure suggests that bulls are regaining control, but confirmation will only come with a decisive close above $4,600.
Featured image from ChatGPT, chart from TradingView.com












 日本語
日本語  English
  Română
  Eesti
Eesti  한국어
한국어  Русский
  Deutsch
  Español
  简体中文
简体中文  Français
  繁體中文
繁體中文  Português
  Italiano
  Polski
  Türkçe
  Nederlands
  Bahasa Indonesia
  Ελληνικά
  Українська
  Български
  Čeština
  Suomi
Suomi  Magyar
  Latviešu valoda
  Lietuvių kalba
  Norsk bokmål
  Slovenčina
  Slovenščina
  Svenska
コメントを残す