

Ethereum is now testing critical resistance after a sharp rally that has caught the attention of analysts and traders alike. Following days of strong upward momentum, ETH has reclaimed the $1,800 mark, recovering over 18% of its value since Tuesday. This impressive rebound signals renewed confidence in the asset amid ongoing global macroeconomic uncertainty and volatility in financial markets.
According to top analyst Gert Van Lagen, Ethereum could be on the verge of a historic breakout. In a recent technical analysis shared on X, Van Lagen pointed to a massive 4-year inverse Head and Shoulders pattern forming on Ethereum’s 1-week chart—a classic bullish reversal signal. With both shoulders now confirmed, the chart formation is targeting a long-term price objective around the $20,000 level.
This development comes as Ethereum continues to strengthen its on-chain fundamentals and recaptures investor attention. While resistance levels ahead remain challenging, the breakout above $1,800, combined with the bullish long-term setup, has positioned Ethereum as one of the most promising assets in the current cryptocurrency landscape. If market sentiment continues to shift in favor of crypto assets, ETH could be entering a powerful expansion phase with $2,000 and beyond within reach.
Ethereum Gears Up For A Rally Forming A Long-Term Reversal Pattern
Ethereum is currently trading 57% below its multi-year high of $4,100, and many investors feel like a full recovery is still far off. However, growing optimism is surfacing across the market as crypto assets begin to regain momentum despite heightened macroeconomic tensions and a deepening trade war between the United States and China. With equities under pressure, Ethereum and other leading cryptocurrencies appear to be carving out independent trajectories—something analysts view as a strong bullish sign.
According to top analyst Van Lagen, Ethereum could be on the verge of a major breakout. In his recent technical analysis, Van Lagen highlights a massive 4-year inverse Head and Shoulders pattern developing on the ETH weekly chart. This classic reversal formation suggests a long-term bullish structure is in play. If confirmed, Van Lagen believes the pattern could send ETH to an ambitious $20,000 target in the next market cycle.
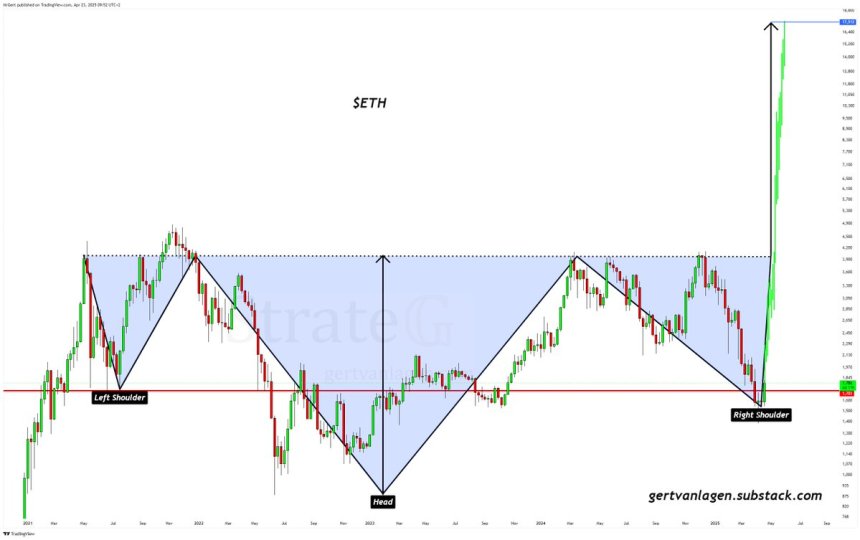
One key factor in Van Lagen’s analysis is the recent shakeout of retail traders. He points to the formation of the Right Shoulder as a moment of capitulation, suggesting that many short-term holders exited their positions, clearing the way for a stronger, more sustained move upward.
ETH Price Tests Support After Key Reclaim
Ethereum is currently trading at $1,740 after successfully reclaiming both the 4-hour 200 MA and EMA, key technical indicators that are now being tested as short-term support. This reclaim is a positive signal for bulls, suggesting that momentum is building after a strong bounce from recent lows. However, the next critical step is to push above the psychological and technical barrier at $2,000.
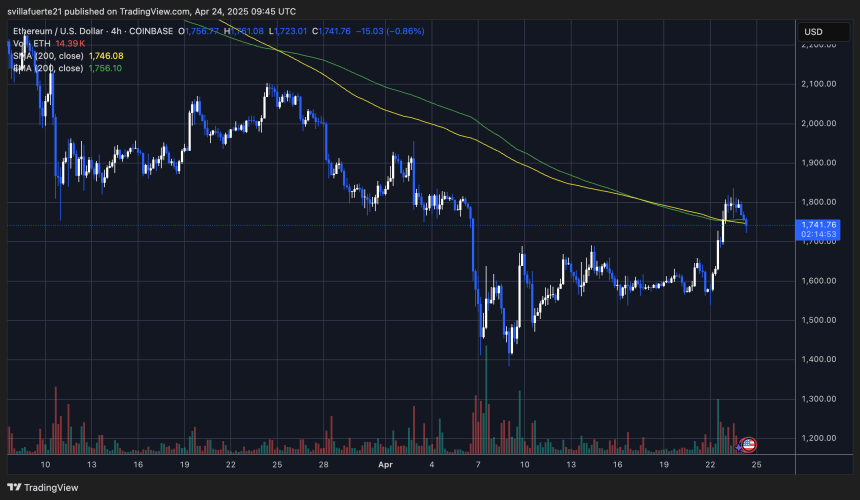
A decisive break and daily close above the $2,000 mark would confirm a trend reversal and likely open the door for a stronger recovery rally. This level has acted as resistance multiple times over the past months, making it a significant benchmark for traders. Bulls must defend the $1,740 zone to maintain the current structure and build the case for continued upward movement.
On the flip side, if Ethereum fails to reclaim $2,000 and loses the $1,700 support zone, further downside pressure could push ETH back into consolidation territory. Such a move would signal hesitation in the market and potentially delay any meaningful breakout in the short term. For now, holding the reclaimed moving averages is essential as Ethereum attempts to solidify a base for its next move.
Featured image from Dall-E, chart from TradingView












 日本語
日本語  English
  Română
  Eesti
Eesti  한국어
한국어  Русский
  Deutsch
  Español
  简体中文
简体中文  Français
  繁體中文
繁體中文  Português
  Italiano
  Polski
  Türkçe
  Nederlands
  Bahasa Indonesia
  Ελληνικά
  Українська
  Български
  Čeština
  Suomi
Suomi  Magyar
  Latviešu valoda
  Lietuvių kalba
  Norsk bokmål
  Slovenčina
  Slovenščina
  Svenska
コメントを残す