While Ethereum’s overall market structure is still dominated by the sellers, recent price action suggests sellers may be losing momentum after the market was held by the $1.5K support region twice. The emergence of a potential double bottom and improving short-term momentum could pave the way for a relief rally if buyers reclaim the next resistance cluster.
Ethereum Price Analysis: The Daily Chart
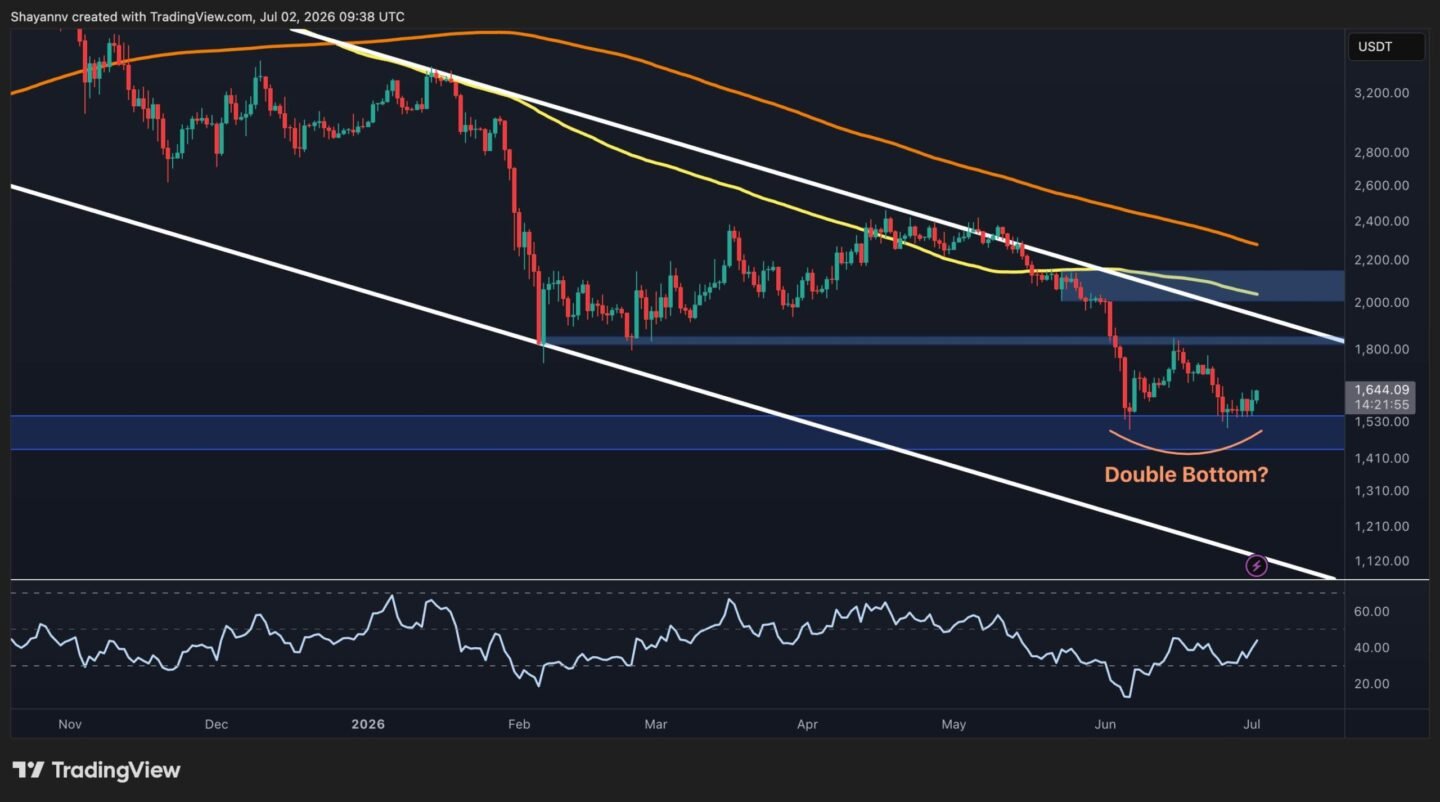
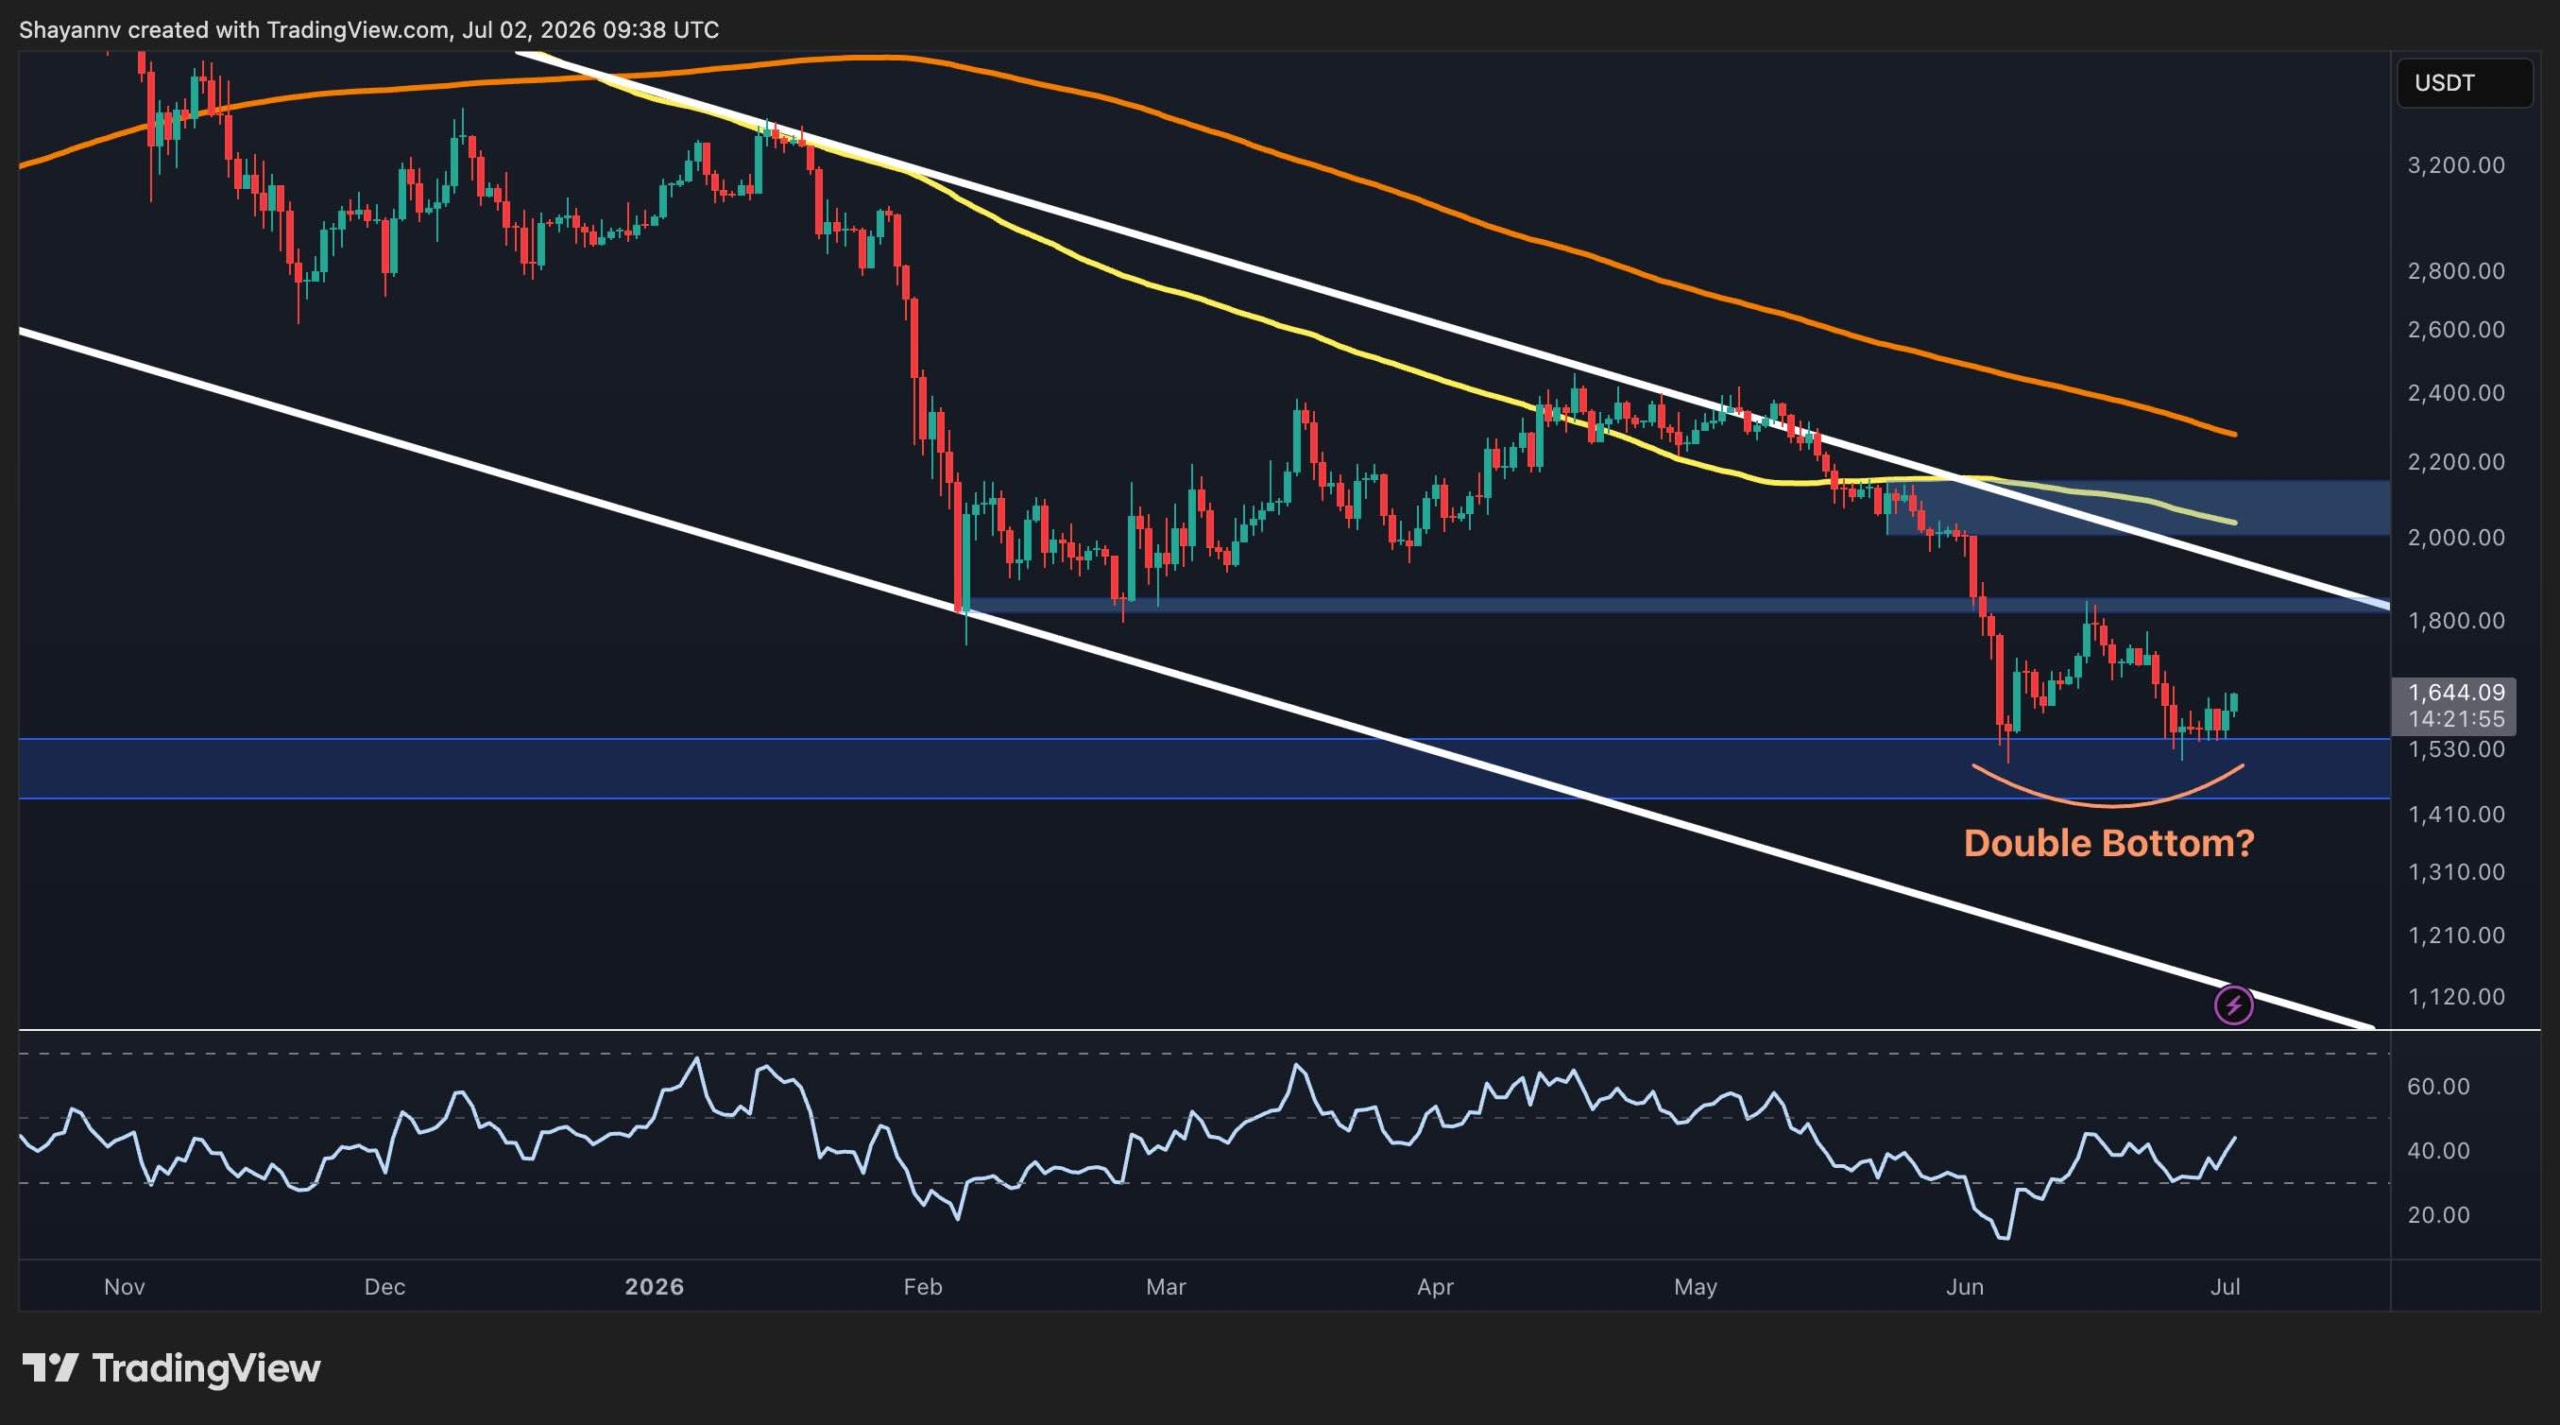
On the daily timeframe, ETH is still trading within the same long-term descending channel that has remained intact for months, with both the long-term moving averages sloping lower just above the channel’s higher boundary. The price remains well below the 100-day and 200-day moving averages, which are currently positioned around the $2K to $2.2K region, confirming that the macro trend is still bearish.
After the sharp sell-off a few weeks ago, the cryptocurrency found strong demand inside the $1.5K support zone. The price has now tested this area twice, raising the possibility of a double-bottom formation. Although the pattern is not confirmed yet, the repeated defense of this support suggests that bearish momentum is fading.
The RSI has also recovered from near-oversold conditions and is gradually pushing higher toward the midline, indicating improving momentum without reaching overbought territory.
For the bullish scenario to gain credibility, ETH needs to reclaim the $1.8K resistance zone to validate the double bottom setup. A successful move above that level would also expose the next major supply area around $2K to $2.2K, where the 100-day and 200-day moving averages converge.
Conversely, losing the $1.5K support zone could likely prove catastrophic, as it would invalidate the potential reversal structure and likely trigger a deeper leg lower within the broader downtrend.
ETH/USDT 4-Hour Chart
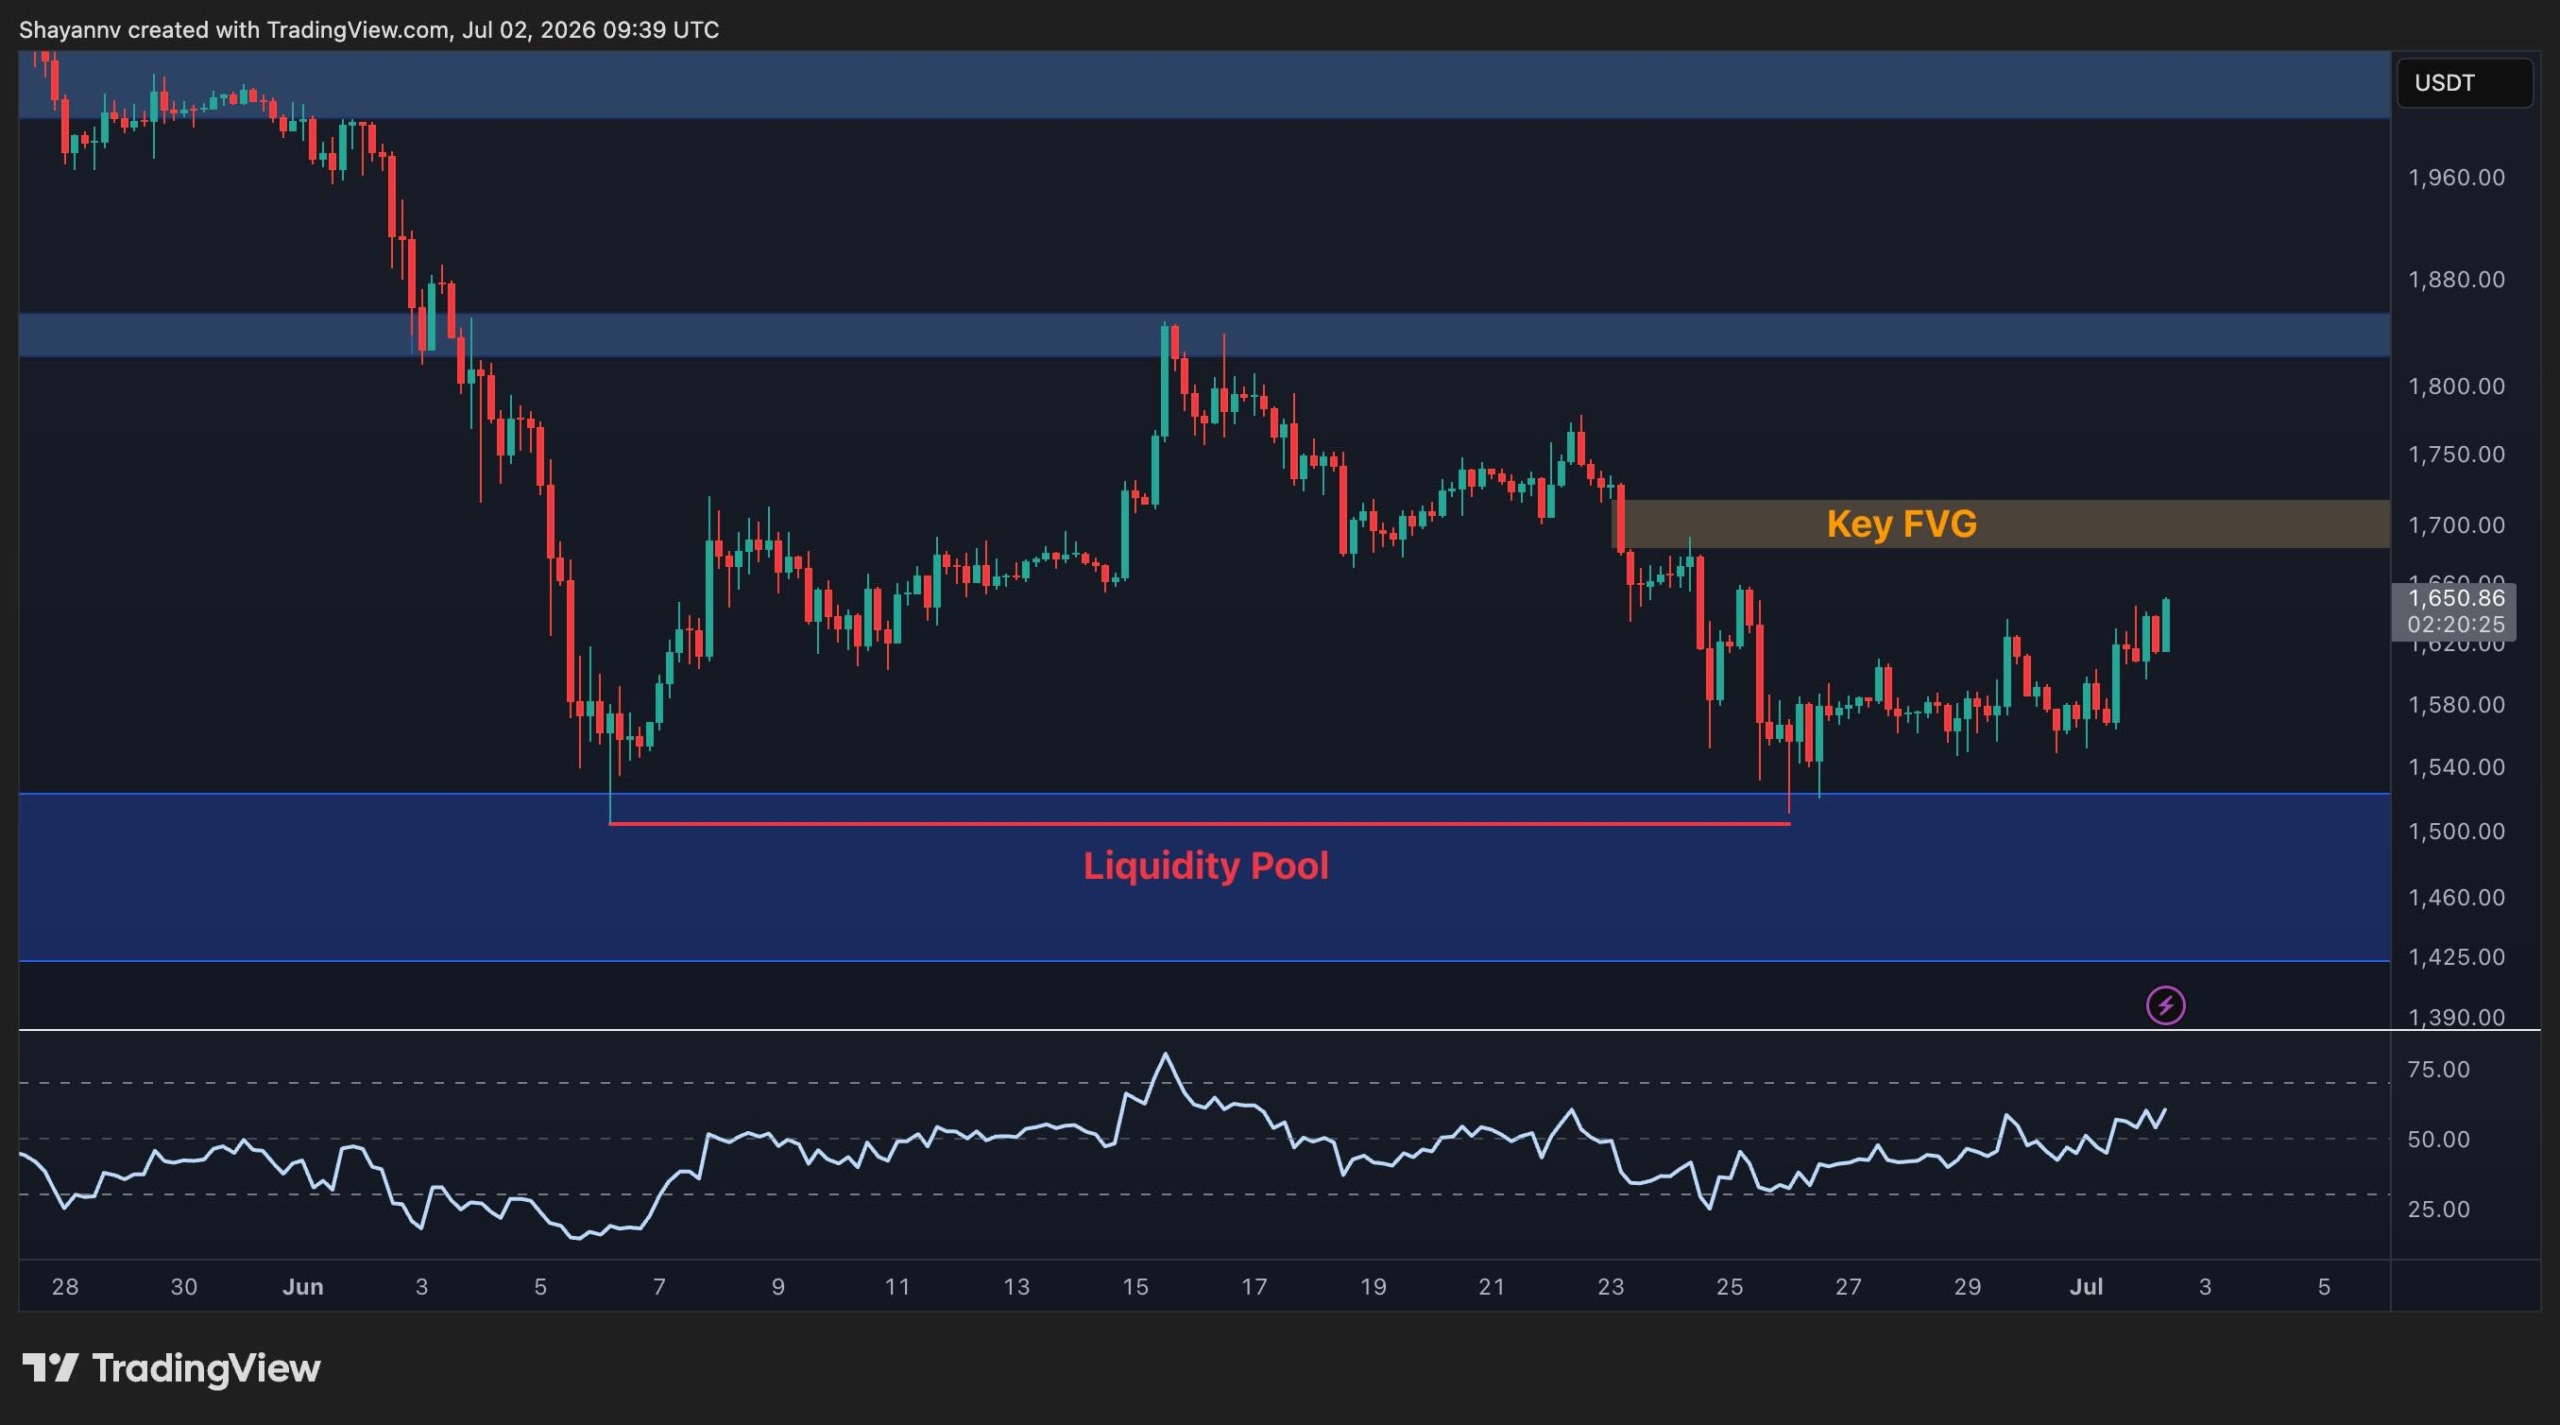
The 4-hour chart presents a clearer short-term picture. The price has built liquidity beneath the $1.5K lows, as buyers stepped back into the market, preventing a lower low. This demand is gradually pushing ETH toward the first area of overhead supply.
The price is currently approaching a key fair value gap at approximately $1.7k. This imbalance coincides with the latest bearish impulse and is likely to attract selling interest. A decisive breakout above this zone would signal improving short-term strength and could open the path toward the $1.85K resistance.
Momentum has also noticeably improved on the lower timeframe, with the RSI climbing toward bullish territory while printing higher lows alongside price. This suggests buyers have regained some control after the recent rebound.
However, unless ETH successfully clears the fair value gap and establishes higher highs, the current advance could still develop into nothing more than a corrective rally within the larger bearish trend.
Sentiment Analysis
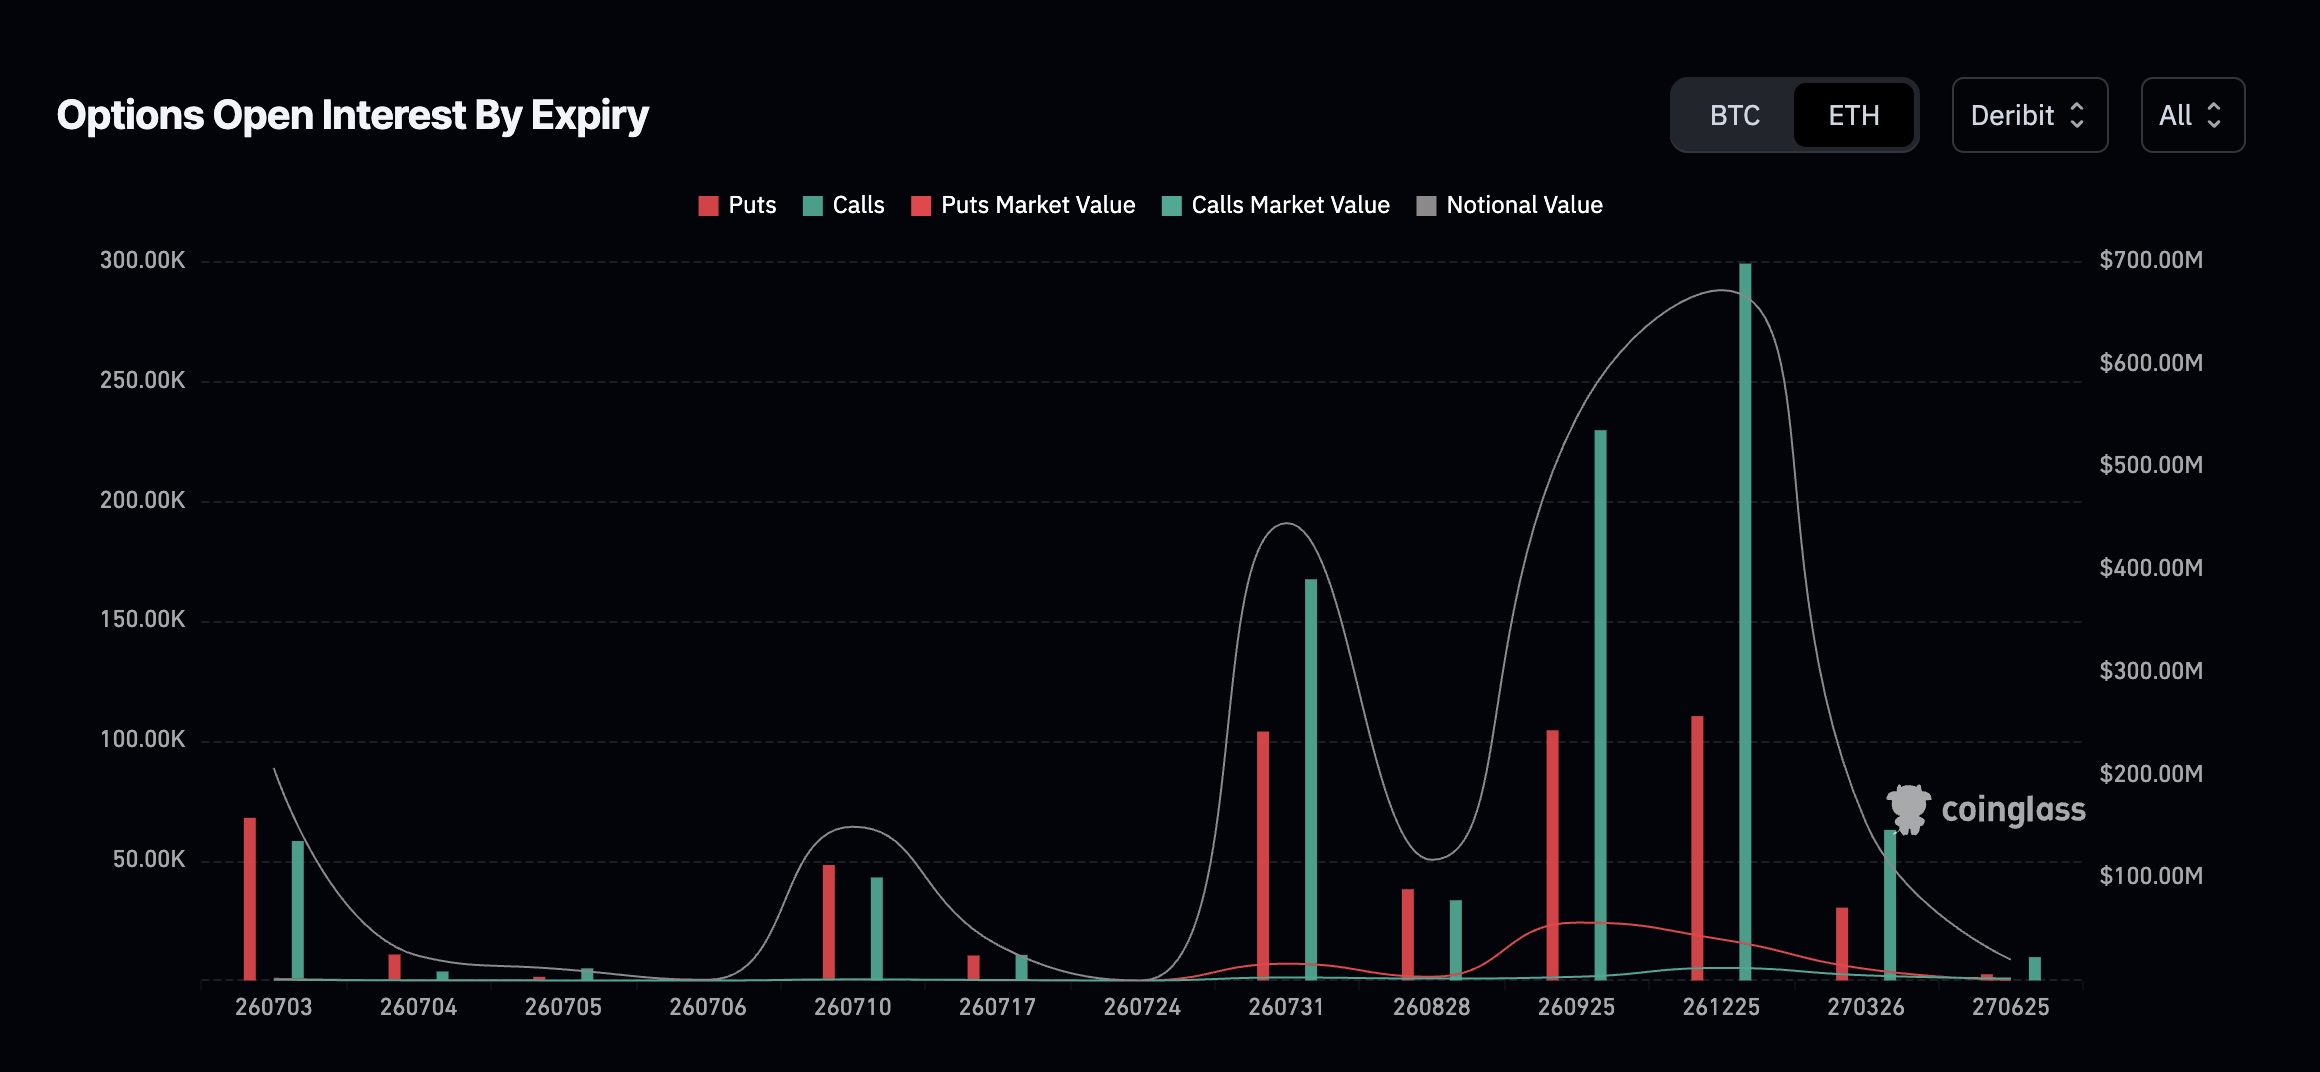
The distribution of open interest in options contracts shows that the largest concentration is positioned around the late December 2026 expiry, where call open interest significantly outweighs put open interest. Several other major expiries, including late September and late July, also display a clear dominance of call positioning.
This skew toward call options suggests that derivatives participants continue positioning for higher prices over the medium to long term despite Ethereum’s recent weakness. At the same time, the substantial notional value concentrated around the larger expiries indicates that these dates could become important volatility catalysts as expiration approaches.
While options positioning alone does not guarantee a bullish outcome, the current distribution reflects a market that still maintains longer-term upside expectations even as spot price remains trapped below major technical resistance. If ETH confirms the developing double-bottom structure and breaks above the nearby resistance cluster, the optimistic options positioning could provide additional tailwinds through improved market sentiment.
ポスト Ethereum Eyes Relief Rally as Double Bottom Forms Near $1.5K (ETH Price Analysis) に初登場した。 クリプトポテト.


コメントを残す