

Bitcoin is attempting to extend its recovery after rebounding sharply from the June lows. The asset is now pressing into an important confluence of resistance, where a descending trendline aligns with a major supply zone.
While buyers have regained short-term momentum, the coming sessions will determine whether this move develops into a broader trend reversal or another lower high within the prevailing structure.
Bitcoin Price Analysis: The Daily Chart
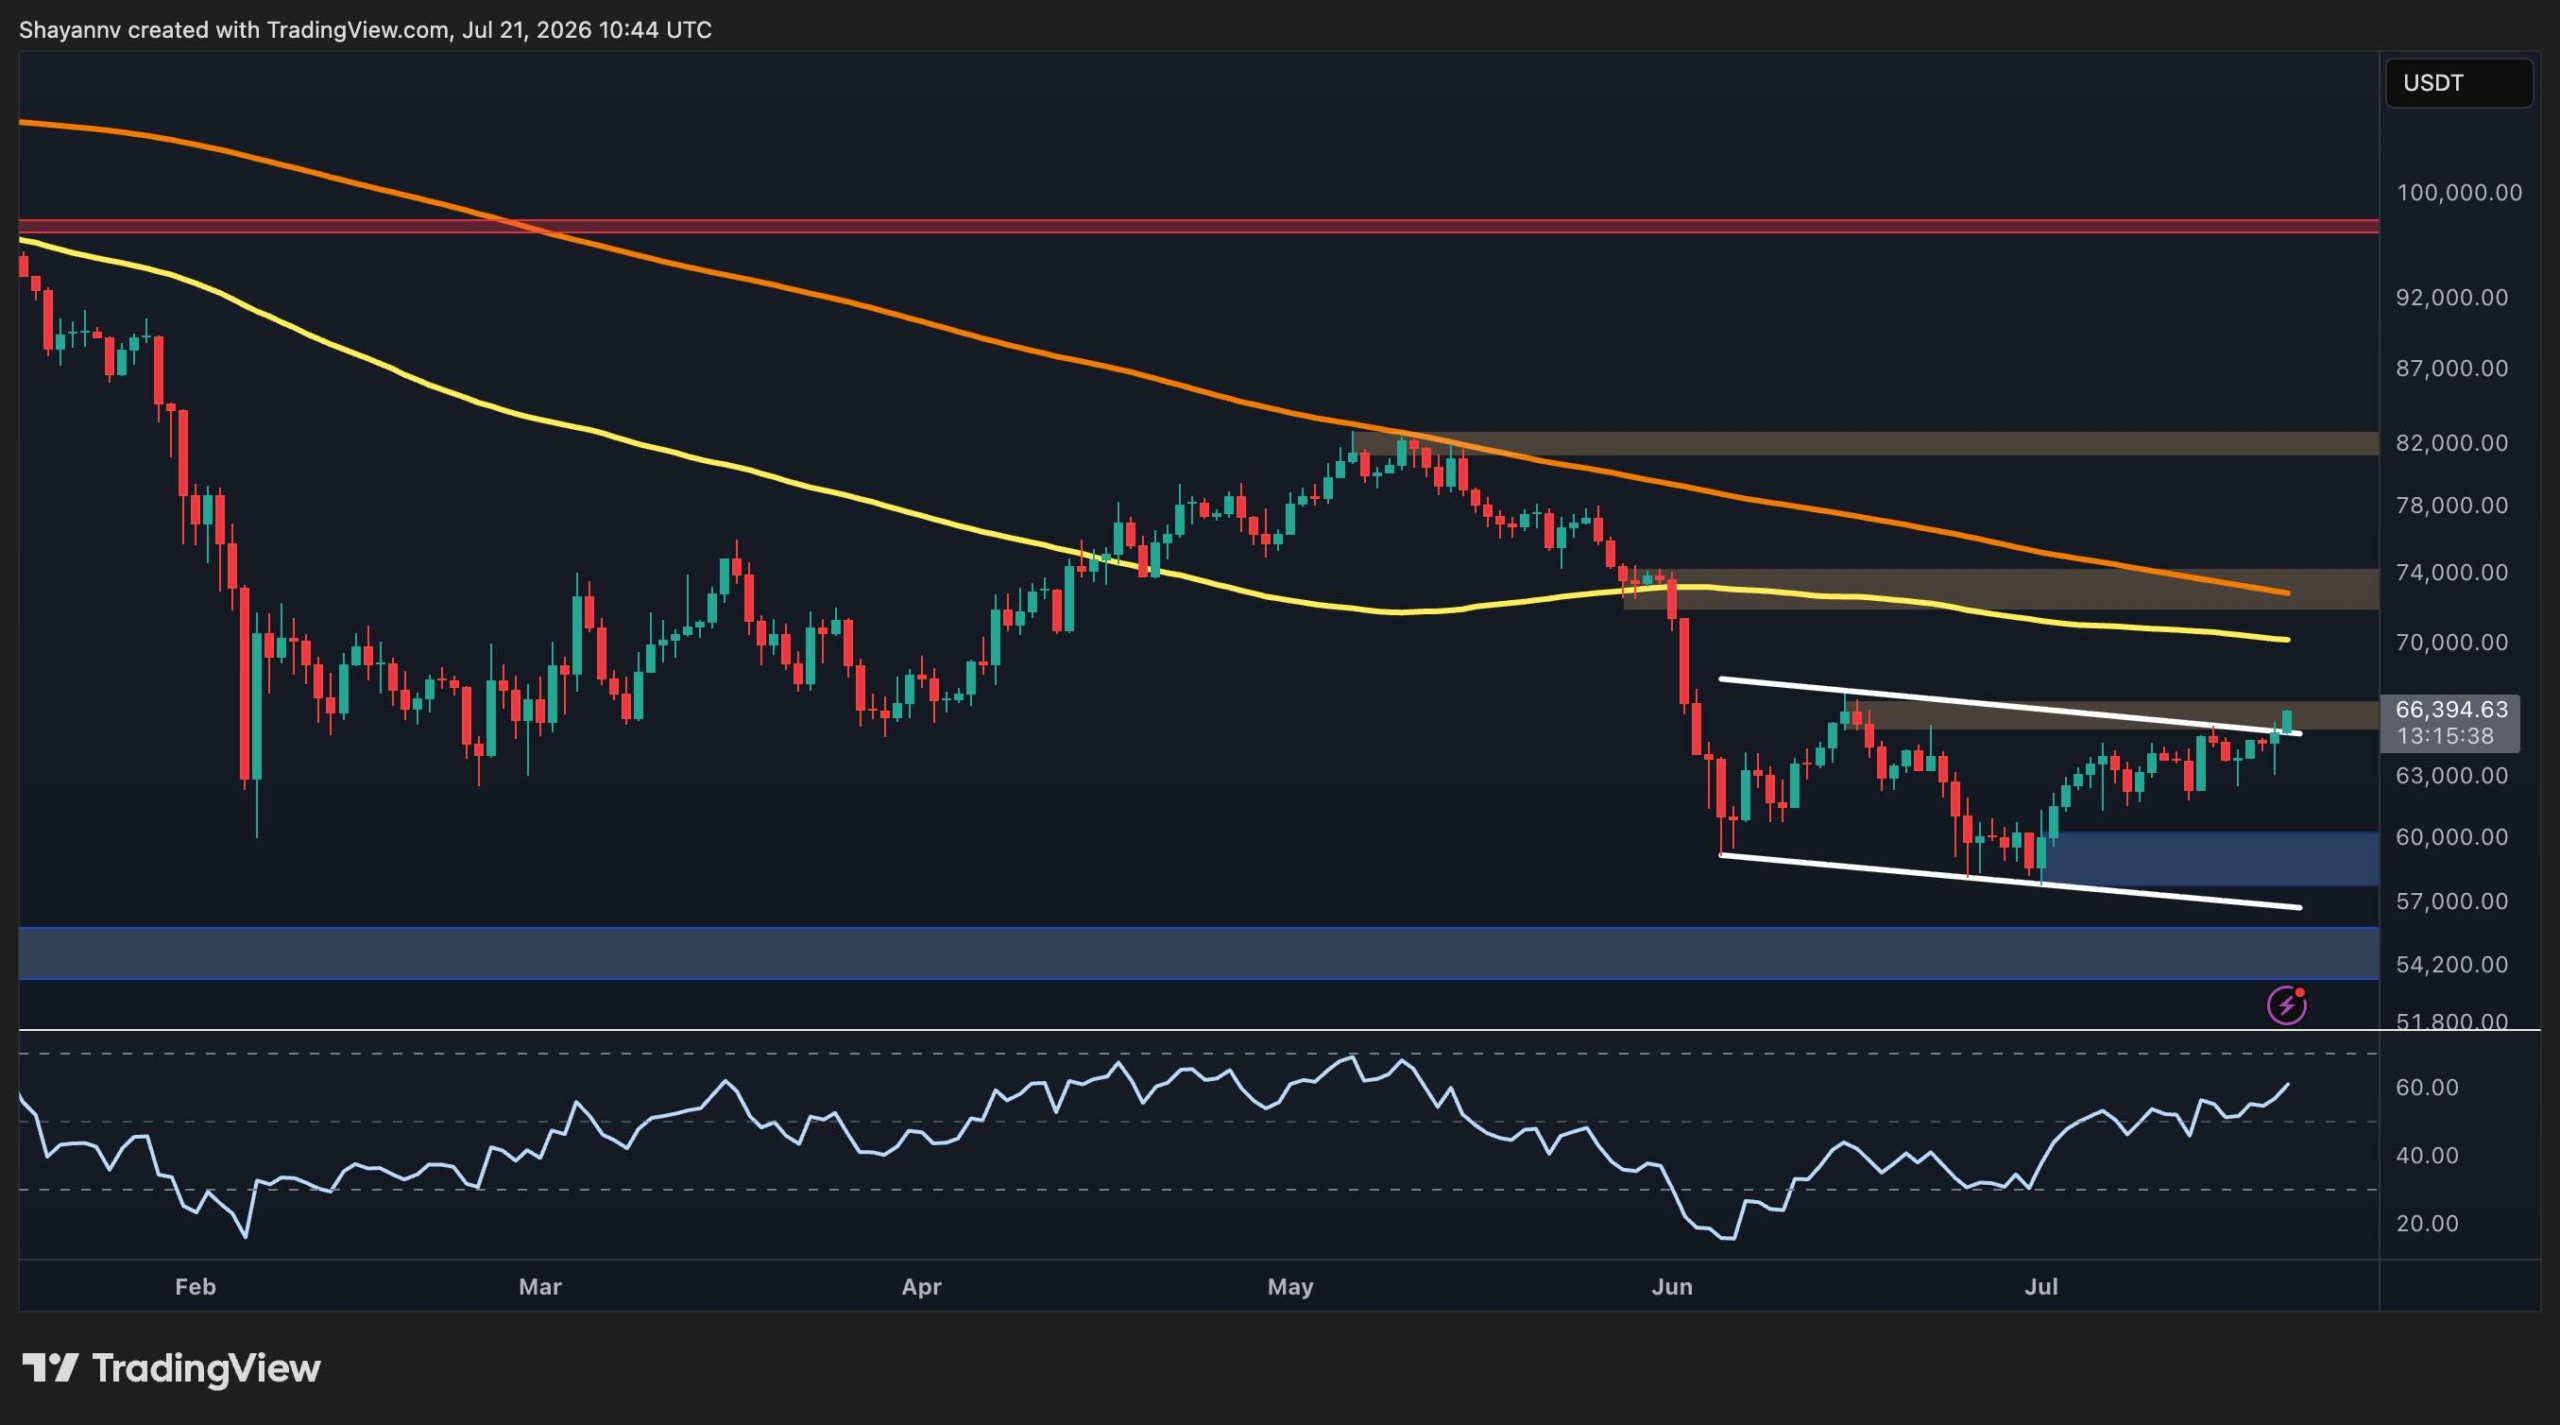
On the daily timeframe, BTC continues to trade below its long-term moving averages, with the 100-day MA positioned around the $70K region and the 200-day MA closer to $73K. Both averages remain downward sloping, indicating that the broader market structure still favors sellers despite the recent recovery.
Following the sharp decline toward the $57K to $60K support area, Bitcoin established a sequence of higher lows inside a narrowing descending channel. The recent rally has carried the price toward the upper boundary of this formation, which coincides with the $66K to $67K resistance zone.
A decisive breakout above both the descending trendline and the $66K to $67K supply area would represent the first meaningful structural improvement since the correction began. Such a move could expose the next resistance level around $74K, where the 200-day moving average and another major supply zone converge.
However, rejection from current levels would reinforce the descending structure and could trigger another pullback toward the $60K support region. Below that, the major demand zone around $55K remains the most important higher timeframe support visible on the chart.
BTC/USDT 4-Hour Chart
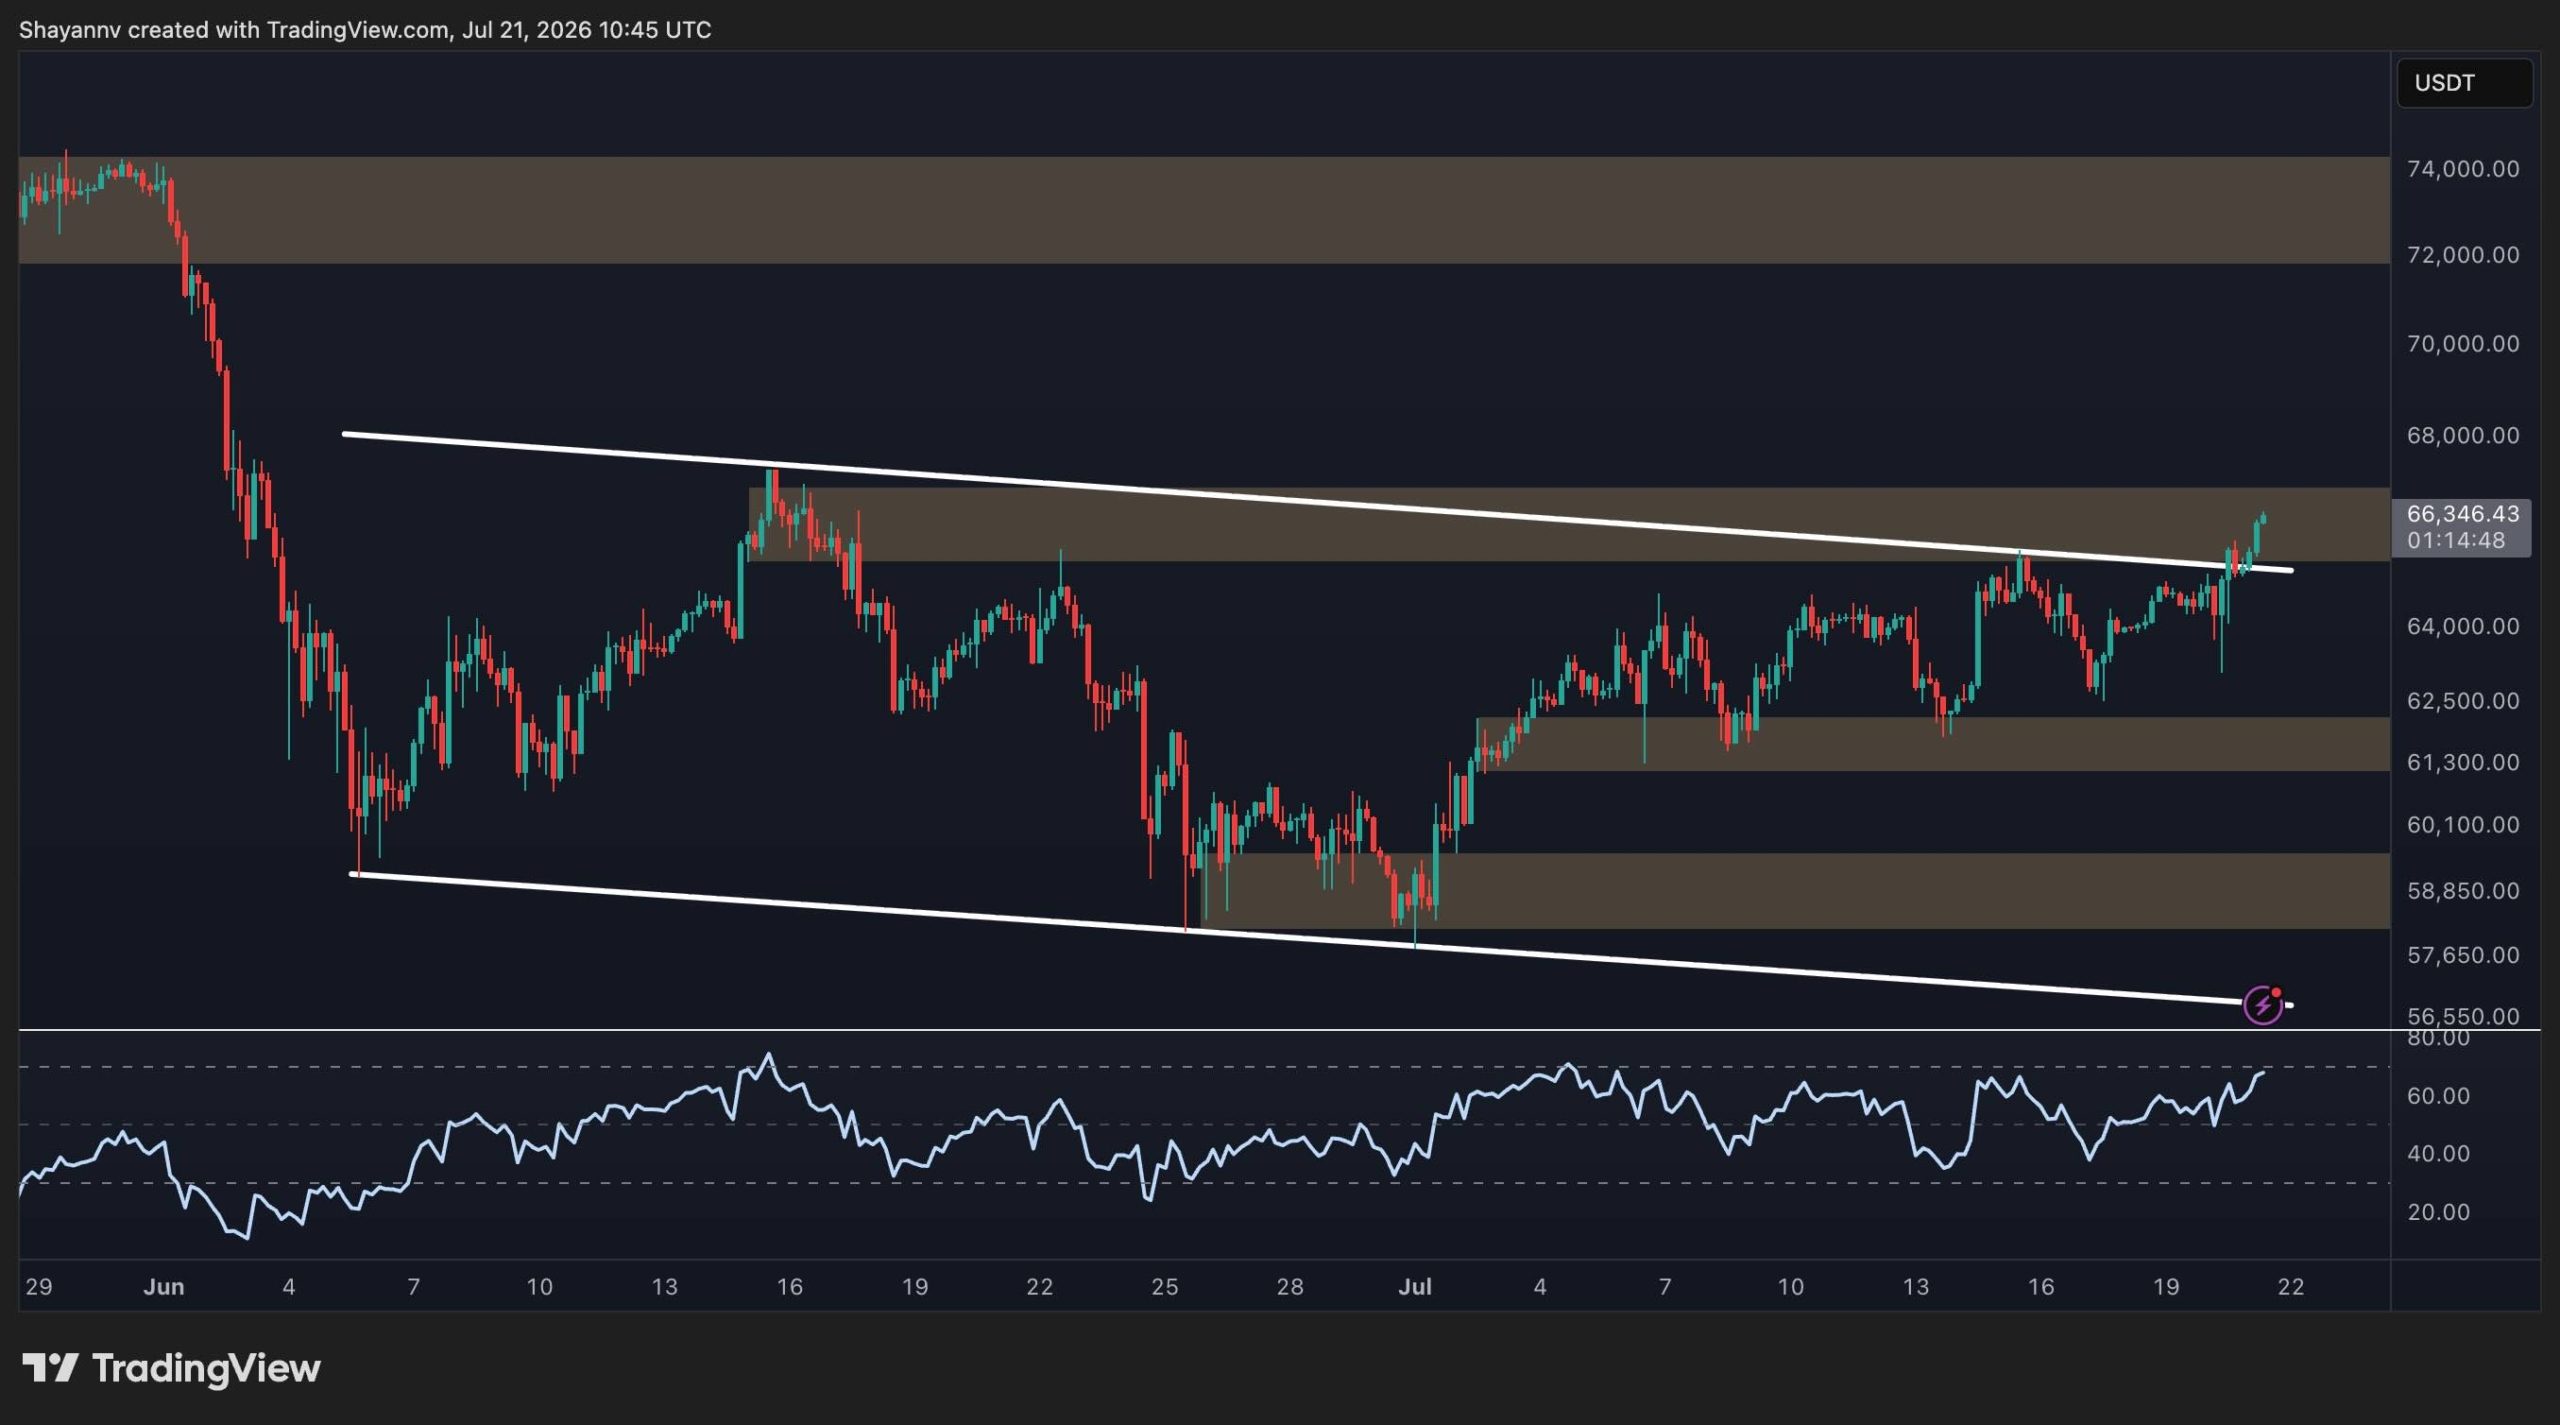
The 4-hour chart presents a more constructive picture. Bitcoin has been respecting a well-defined descending channel since early June, but recent price action shows buyers steadily reclaiming higher support levels after defending the channel’s lower boundary around $58K.
The market has already broken above several intermediate resistance zones at roughly $58K and $61K before advancing toward the current resistance cluster around $66K. This area also aligns with the channel’s upper trendline, making it the key short-term battleground.
Unlike previous tests, the latest advance has been accompanied by stronger momentum, with RSI pushing toward the overbought territory near 70. This reflects increasing buying pressure but also raises the possibility of a short-term pause or local pullback if profit-taking emerges at resistance.
If the breakout above the channel holds, it could invalidate the current bearish corrective structure and pave the way for an advance toward the next higher timeframe resistance around $72K to $74K.
Conversely, failure to overcome this ceiling would likely keep Bitcoin oscillating inside the channel, with initial support located near $61K followed by the stronger demand region around $58K.
On-Chain Analysis
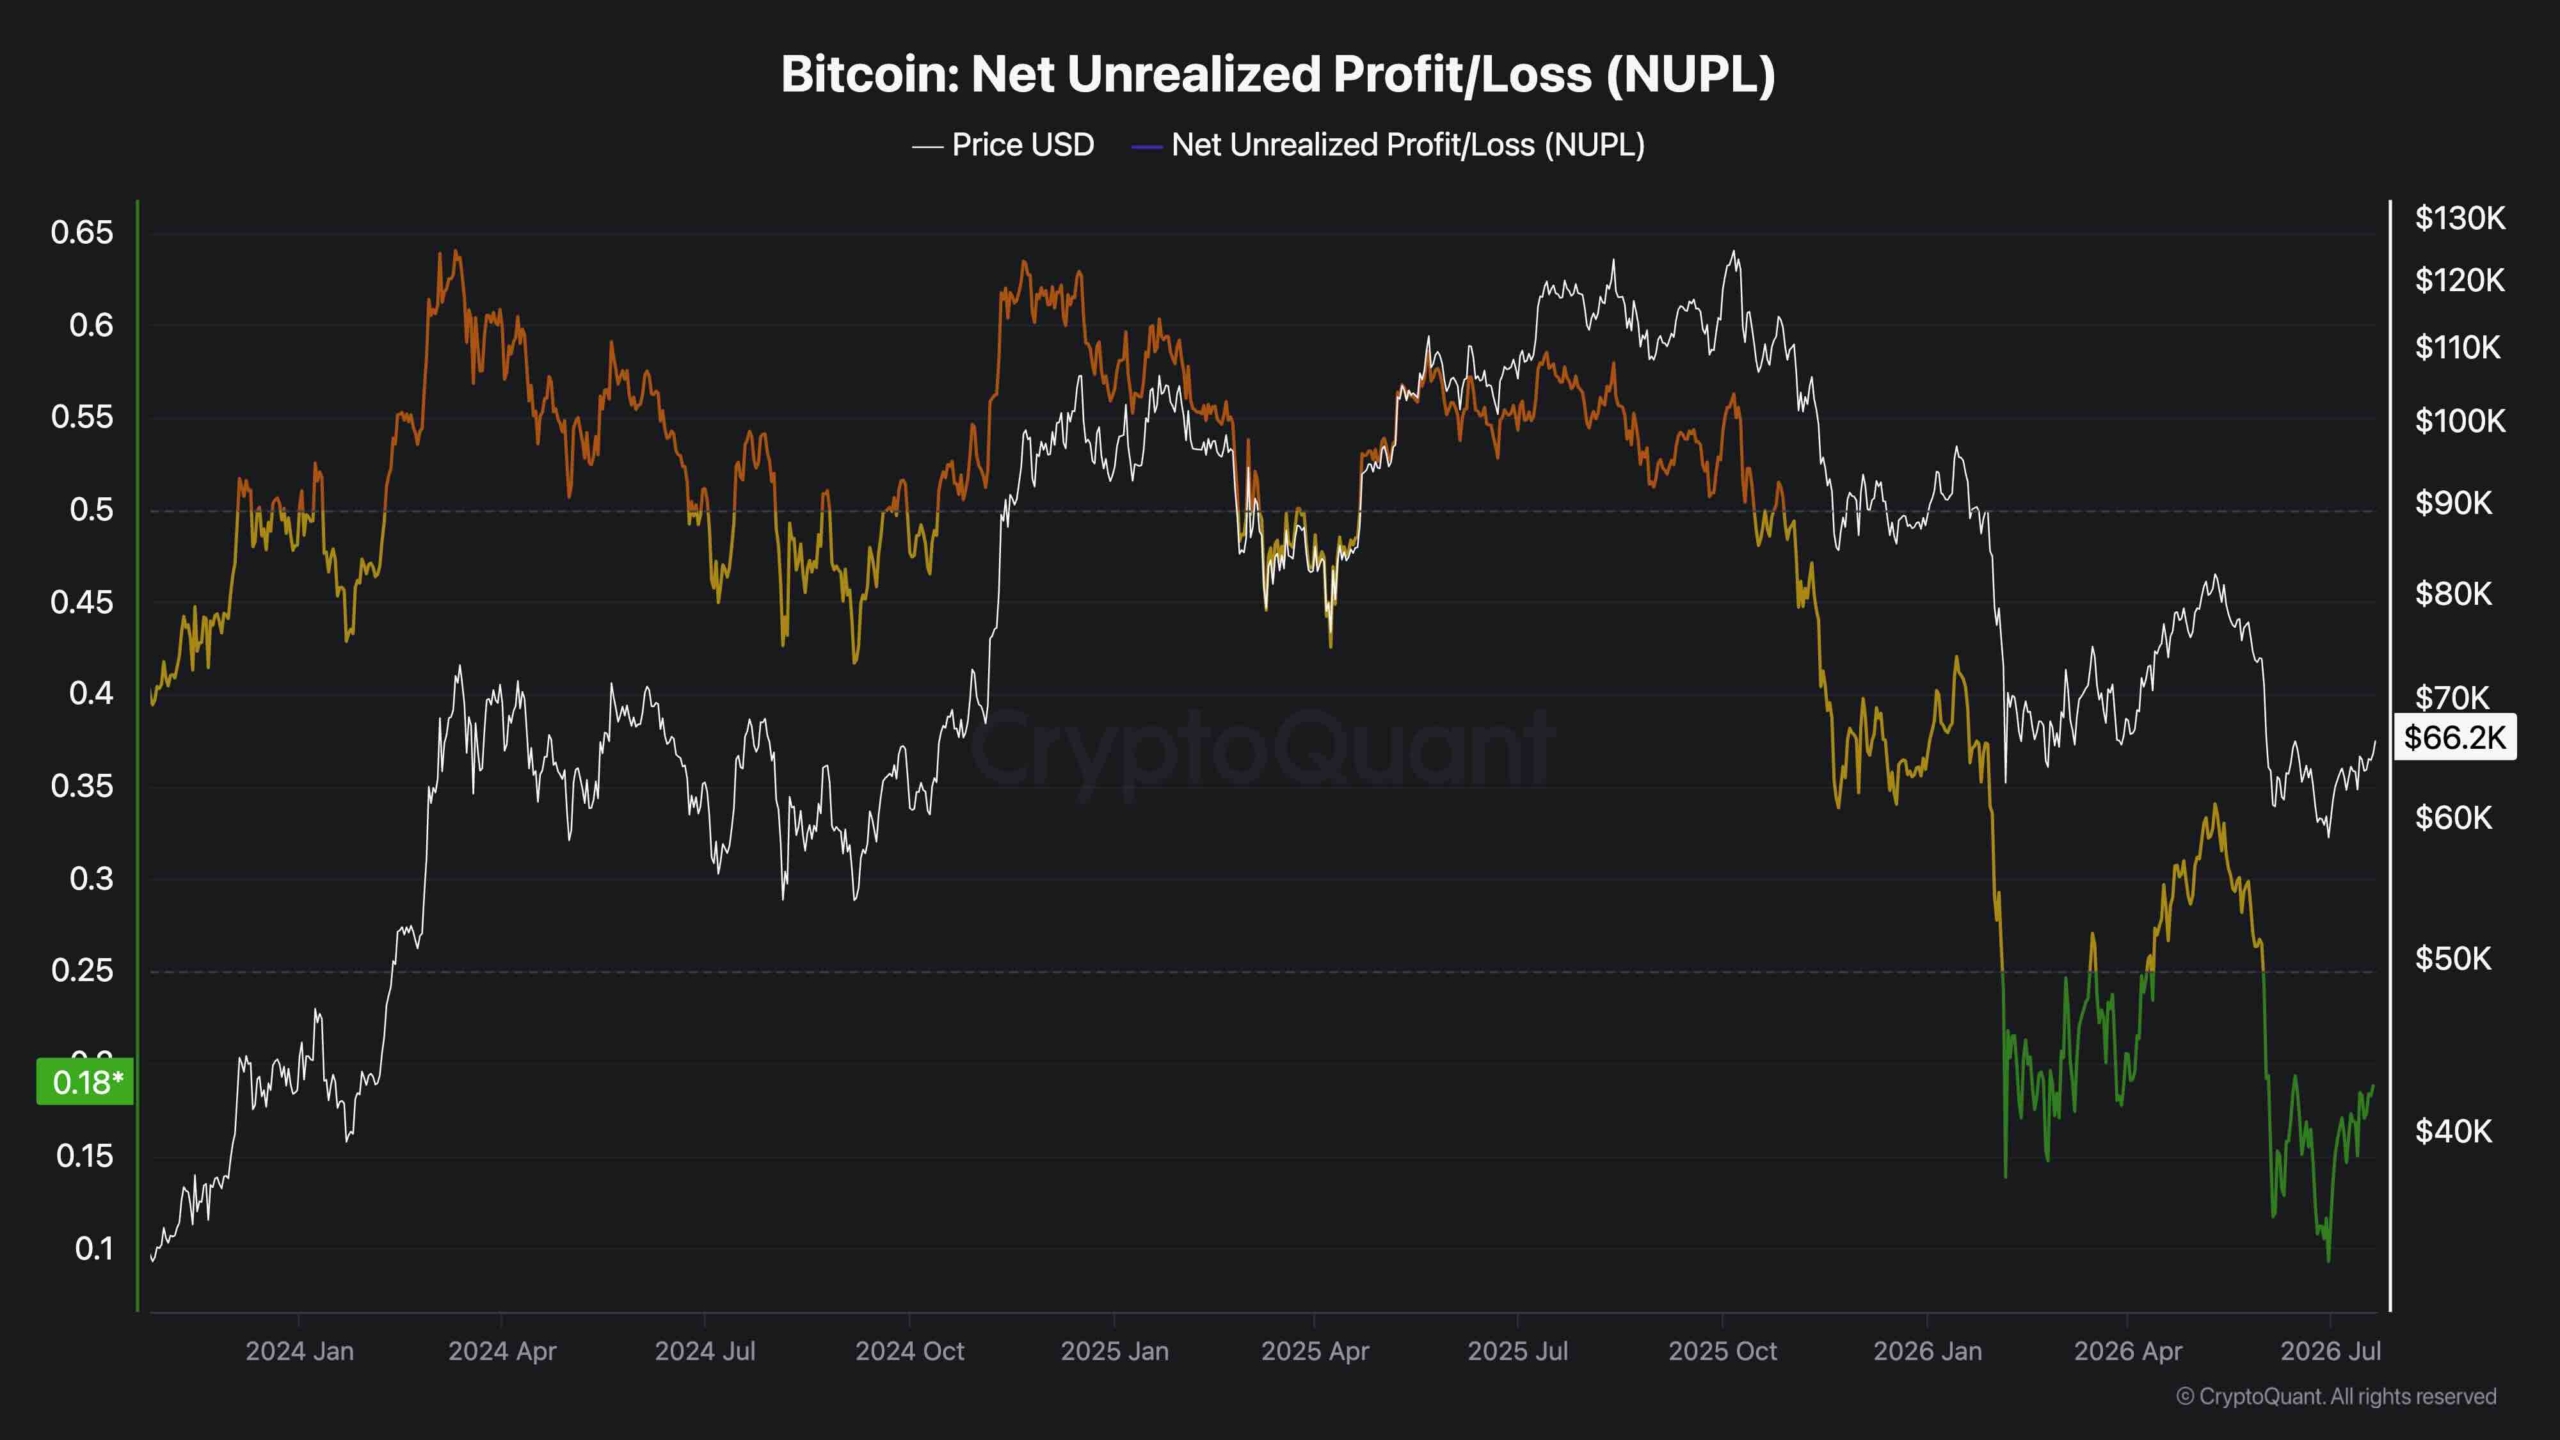
The Bitcoin Net Unrealized Profit/Loss (NUPL) metric currently sits around 0.18, well below the euphoric levels observed during previous market peaks.
NUPL measures the aggregate unrealized profits and losses across the network. Elevated readings generally indicate widespread investor optimism and increasing profit-taking risk, while lower values suggest that market participants are holding significantly smaller unrealized gains.
The recent recovery in NUPL from deeply depressed levels indicates that profitability across the network is gradually improving alongside price. However, the indicator remains firmly within the lower sentiment bands and is still far from the overheated conditions that historically accompanied cycle tops.
This suggests that, from an on-chain perspective, the market has not yet entered an excessive profit-taking phase. If Bitcoin manages to break above its current technical resistance, continued improvement in NUPL would likely support a healthier and more sustainable recovery. On the other hand, a rejection at current levels could temporarily stall the metric’s recovery without necessarily invalidating the broader rebuilding process.
ポスト Bitcoin Price Analysis: Is $70K Next After BTC Broke Above $66K? に初登場した。 クリプトポテト.









 日本語
日本語  English
  Română
  Eesti
Eesti  한국어
한국어  Русский
  Deutsch
  Español
  简体中文
简体中文  Français
  繁體中文
繁體中文  Português
  Italiano
  Polski
  Türkçe
  Nederlands
  Bahasa Indonesia
  Ελληνικά
  Українська
  Български
  Čeština
  Suomi
Suomi  Magyar
  Latviešu valoda
  Lietuvių kalba
  Norsk bokmål
  Slovenčina
  Slovenščina
  Svenska
コメントを残す