
Bitcoin’s November sell-off has extended, and it now trades around $64K, down roughly 14% over the past week.
Rising expectations of a Fed rate hike, persistent spot ETF outflows, and a tech-stock slide ahead of Nvidia’s earnings have weighed on risk assets. BTC has also closed below its 200-week moving average near $68K, so the current demand zone has become a key test. Meanwhile, the Adjusted SOPR shows that holders are now realizing losses on average, a condition that has often appeared near previous local bottoms.
Bitcoin Price Analysis: The Daily Chart
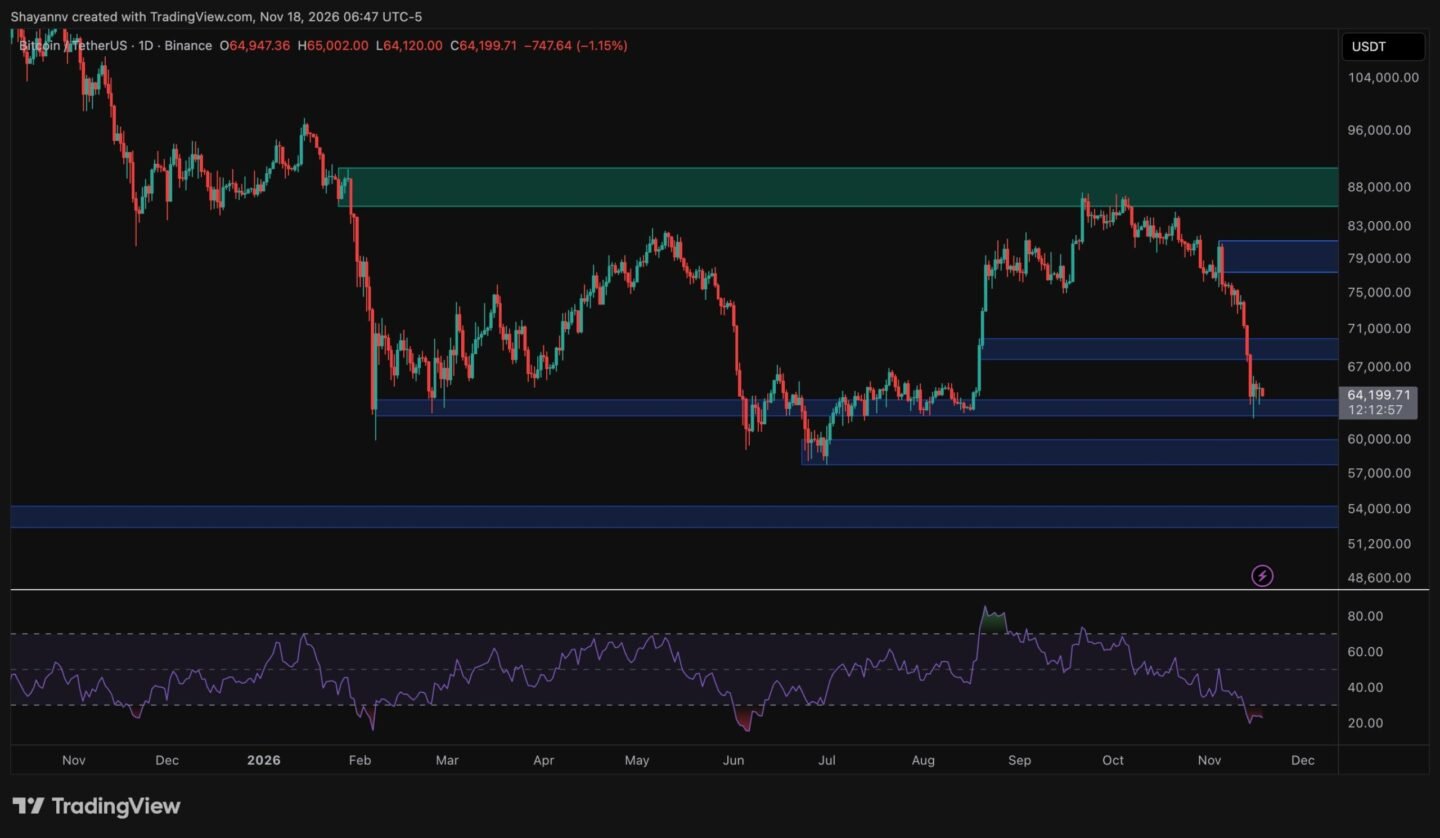
On the daily timeframe, Bitcoin has given back almost all of its summer recovery. After two failed attempts to break the $86K–$90K supply zone in September and October, the price formed lower highs. It then lost the $78K–$81K order block and fell through the $68K demand zone with a series of large bearish candles.
BTC is now sitting on the $63K support. This level held the market during the June–August consolidation and served as the springboard for the August rally. A long lower wick toward $62K shows that buyers are responding, but the rebound has so far been shallow. A decisive daily close below this area would expose the $58K–$60K zone, which marks the July bottom, followed by the deeper $52K–$54K demand region.
The RSI has dropped to approximately 25, deep in oversold territory. Similar readings in February and June came before relief bounces. However, any recovery would first face the $68K level, now overhead supply that lines up with the 200-week moving average. Until buyers reclaim that area, the daily structure remains bearish.
BTC/USDT 4-Hour Chart
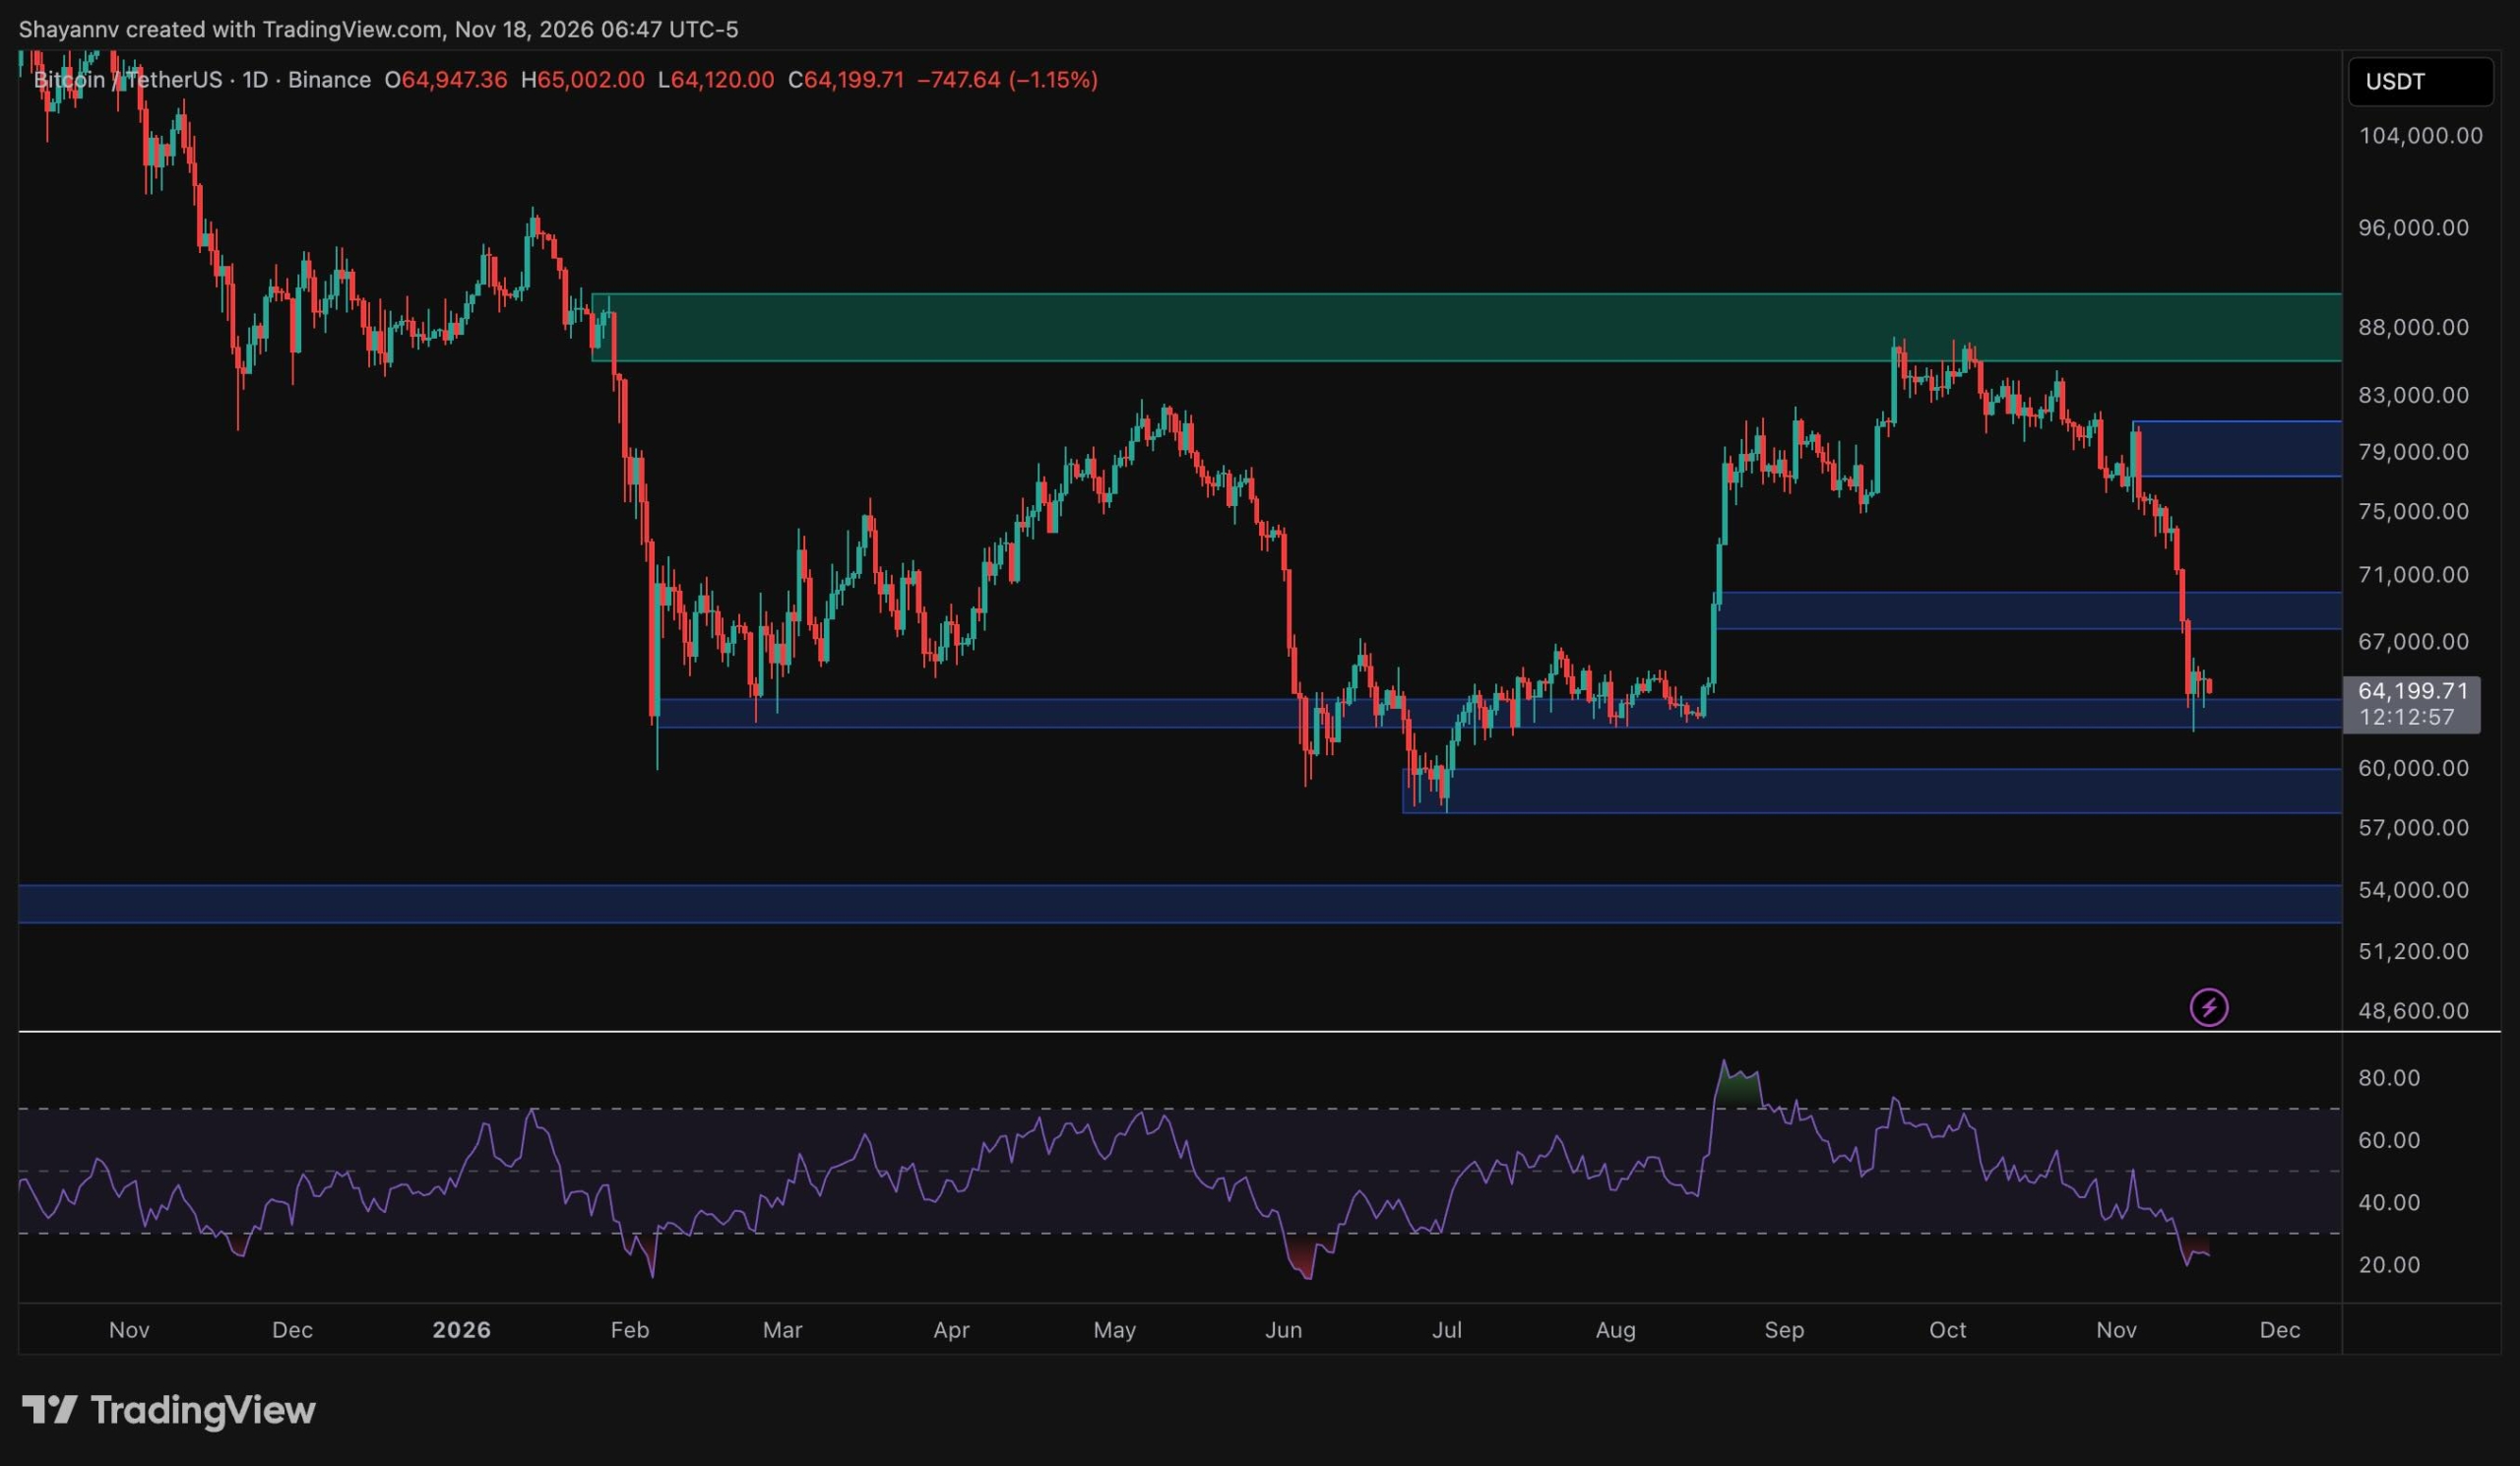
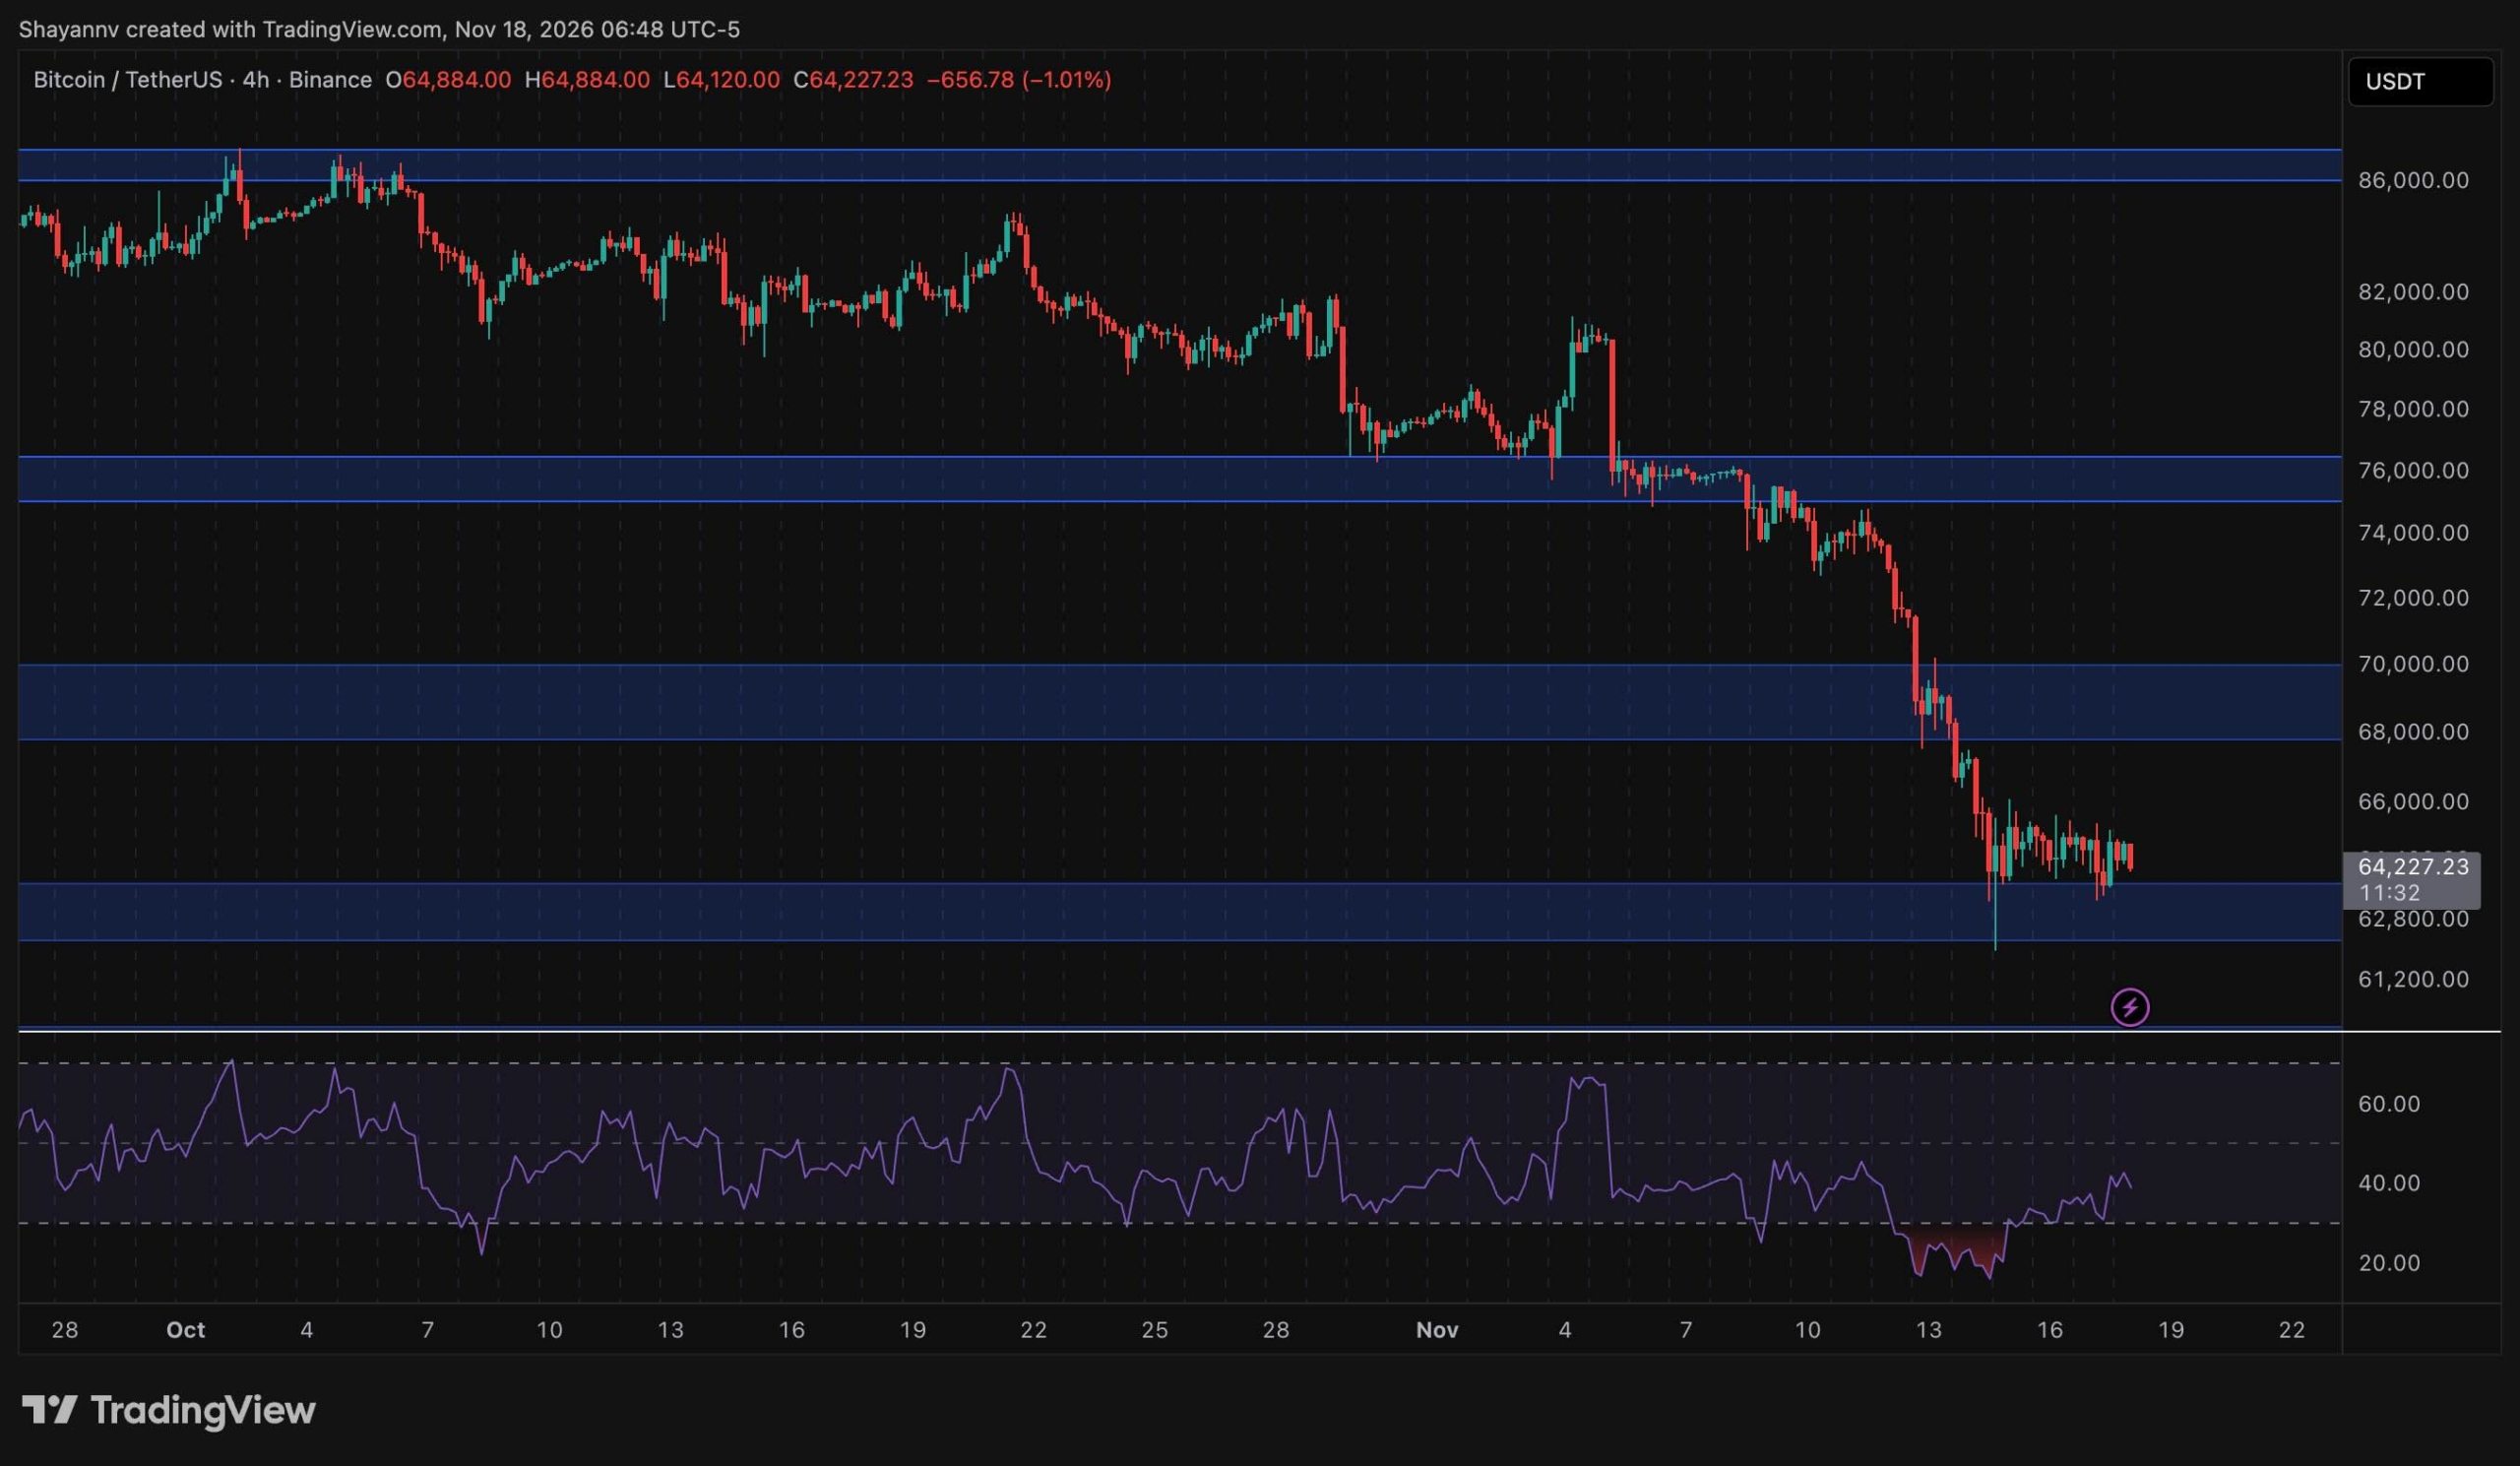
The 4-hour chart shows a clear downtrend that has been building since early October. The loss of $76K support in early November marked a turning point, and the decline then accelerated through the $68K–$70K zone. Since the November 14 flush toward $62K, Bitcoin has been moving sideways in a tight range just above the $63K demand zone.
Momentum has begun to improve slightly. The RSI has recovered from below 30 to about 40 and printed higher lows while price retested $63K, suggesting selling pressure is easing. A move above $66K could open the way for a relief rally toward the $68K–$70K supply zone, where sellers would likely become active again.
On the other hand, a clean breakdown below $63K would invalidate the current base-building attempt and would likely send the price toward $60K. For now, the short-term pattern points to consolidation within a broader downtrend, and the next directional move depends on whether buyers can keep defending $63K.
On-Chain Analysis
The Adjusted Spent Output Profit Ratio (aSOPR) on CryptoQuant compares the selling price of moved coins with the price at which they were acquired. Readings above 1 indicate that coins are being sold at a profit on average, while readings below 1 indicate that holders are realizing losses.
The chart tracks its 30-day exponential moving average.
The metric peaked near 1.07 in late 2024 and has trended lower since, following Bitcoin’s broader decline. During 2026, sub-1 readings appeared in February and again in June–July, as BTC fell toward the $60K region. Both periods were followed by recoveries. The EMA then climbed back to approximately 1.01 during the rally toward $88K, but it has now dropped sharply below 0.99.
This shift suggests that recent buyers are capitulating and selling at a loss, which often helps wash out weak hands. However, the February episode shows that the metric can stay below 1 for weeks before a sustained rebound. A return above 1, combined with a successful defense of the $63K support, would offer stronger evidence that selling pressure has run its course.

ポスト Bitcoin Price Analysis: BTC at a Breaking Point as $63K Support Faces Critical Test に初登場した。 クリプトポテト.










 日本語
 English
 Română
 Eesti
 한국어
 Русский
 Deutsch
 Español
 简体中文
 Français
 繁體中文
 Português
 Italiano
 Polski
 Türkçe
 Nederlands
 Bahasa Indonesia
 Ελληνικά
 Українська
 Български
 Čeština
 Suomi
 Magyar
 Latviešu valoda
 Lietuvių kalba
 Norsk bokmål
 Slovenčina
 Slovenščina
 Svenska
コメントを残す