
Bitcoin price started a downside correction from the $64,600 zone. BTC is showing bearish signs and might continue lower below $61,200.
- Bitcoin failed to stay above $64,000 and extended losses.
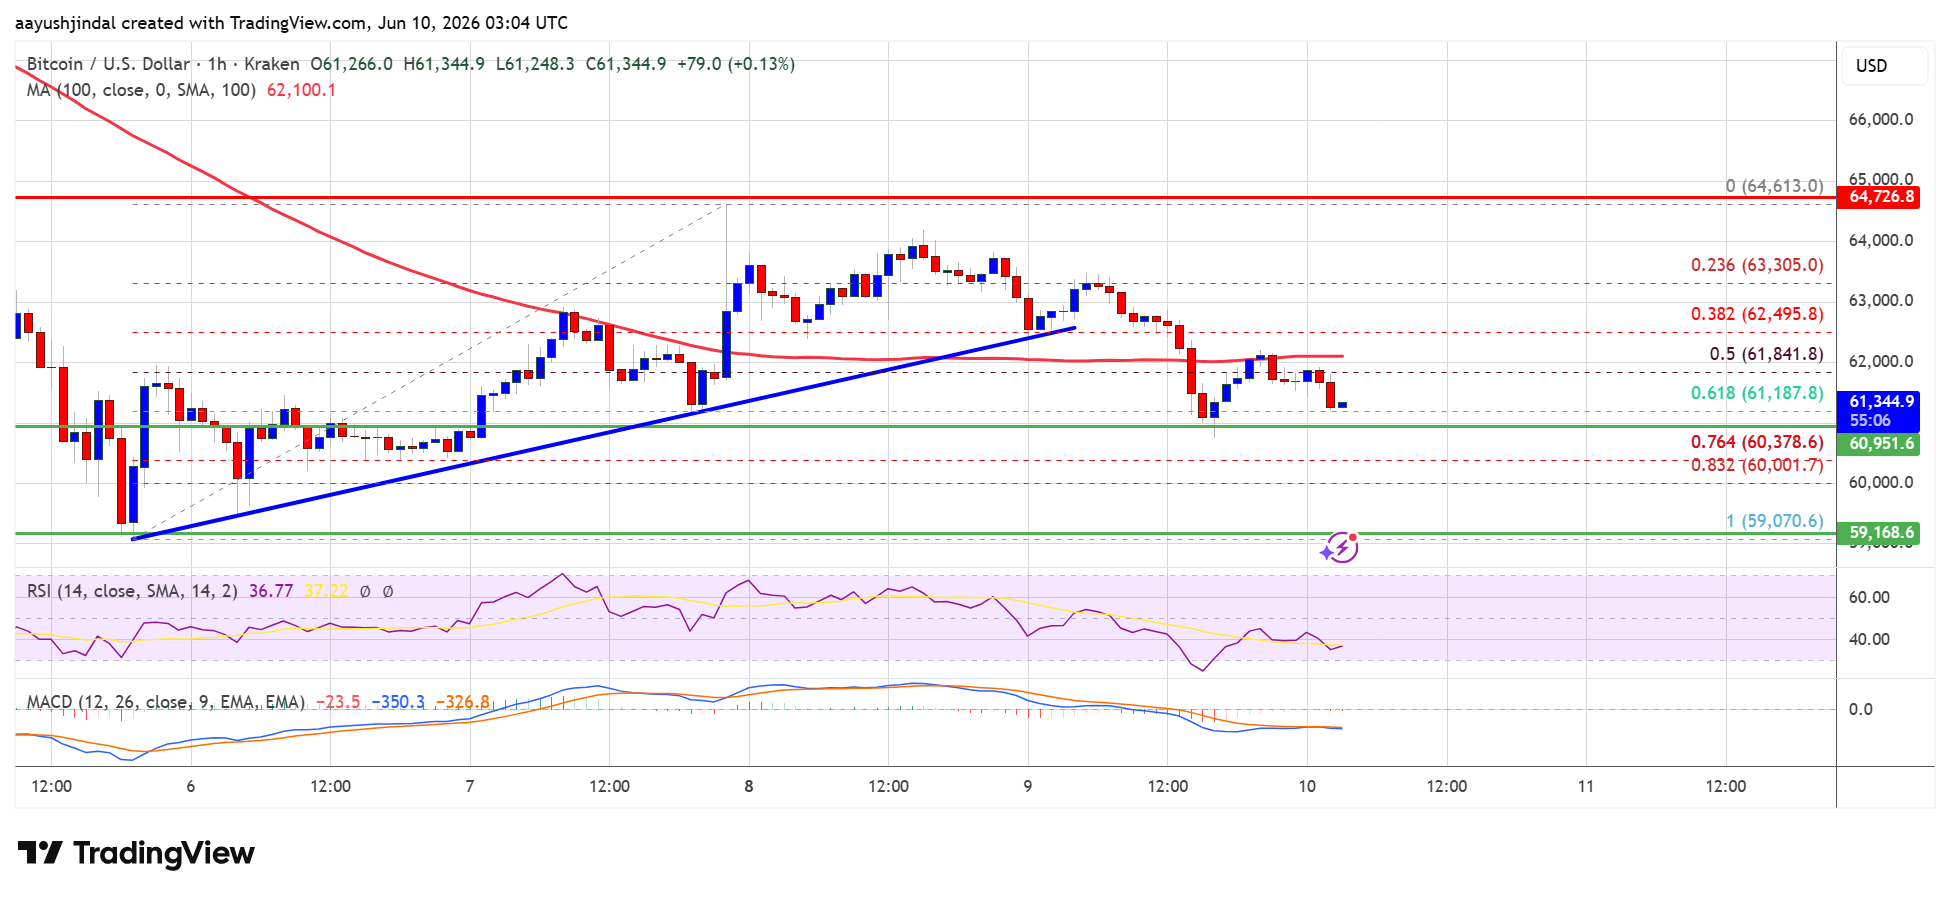
- The price is trading below $62,800 and the 100 hourly simple moving average.
- There was a break below a bullish trend line with support at $62,500 on the hourly chart of the BTC/USD pair (data feed from Kraken).
- The pair might extend losses if it stays below the $62,500 and $62,200 levels.
Bitcoin Price Dips Again
Bitcoin price failed to clear the $64,500 resistance zone. BTC started a downside correction and declined below the key support at $63,500 to enter a bearish zone.
There was a move below the 50% Fib retracement level of the upward move from the $59,070 swing low to the $64,613 high. Besides, there was a break below a bullish trend line with support at $62,500 on the hourly chart of the BTC/USD pair.
Bitcoin is now trading below $62,500 and the 100 hourly simple moving average. If the price remains stable above $61,500, it could attempt a fresh increase. Immediate resistance is near the $62,000 level. The first key resistance is near the $62,200 level.
A close above the $62,200 resistance might send the price further higher. In the stated case, the price could rise and test the $64,000 resistance. The next resistance could be near the $64,500 level. Any more gains might send the price toward the $66,000 level. The main hurdle for the bulls could be $66,500.
Downside Extension In BTC?
If Bitcoin fails to rise above the $62,500 resistance zone, it could start another decline. Immediate support is near the $61,200 level or the 61.8% Fib retracement level of the upward move from the $59,070 swing low to the $64,613 high.
The first major support is near the $60,950 level. The next support is now near the $60,200 zone. Any more losses might send the price toward the $59,000 support in the near term. The main support now sits at $58,500, below which BTC might struggle to recover in the near term.
Technical indicators:
Hourly MACD – The MACD is now gaining pace in the bearish zone.
Hourly RSI (Relative Strength Index) – The RSI for BTC/USD is now below the 50 level.
Major Support Levels – $61,200, followed by $60,200.
Major Resistance Levels – $62,500 and $64,000.


Tinggalkan Balasan