
Bitcoin price is struggling to settle above $112,500 and $113,000. BTC is now moving lower and might start another decline below $108,000.
- Bitcoin started a fresh decline after it failed to clear the $113,000 resistance level.
- The price is trading below $110,000 and the 100 hourly Simple moving average.
- There is a bearish trend line forming with resistance at $110,500 on the hourly chart of the BTC/USD pair (data feed from Kraken).
- The pair might continue to move down if it trades below the $107,500 zone.
Bitcoin Price Dips Again
Bitcoin price failed to surpass the $113,000 resistance level and started a fresh decline. BTC dipped below the $112,000 and $110,500 support levels to enter a bearish zone.
The price even dipped below $108,000. A low was formed at $107,483 and the price is now consolidating losses below the 23.6% Fib retracement level of the recent decline from the $115,975 swing high to the $107,483 low.
Bitcoin is now trading below $110,000 and the 100 hourly Simple moving average. Besides, there is a bearish trend line forming with resistance at $110,500 on the hourly chart of the BTC/USD pair. Immediate resistance on the upside is near the $109,500 level.
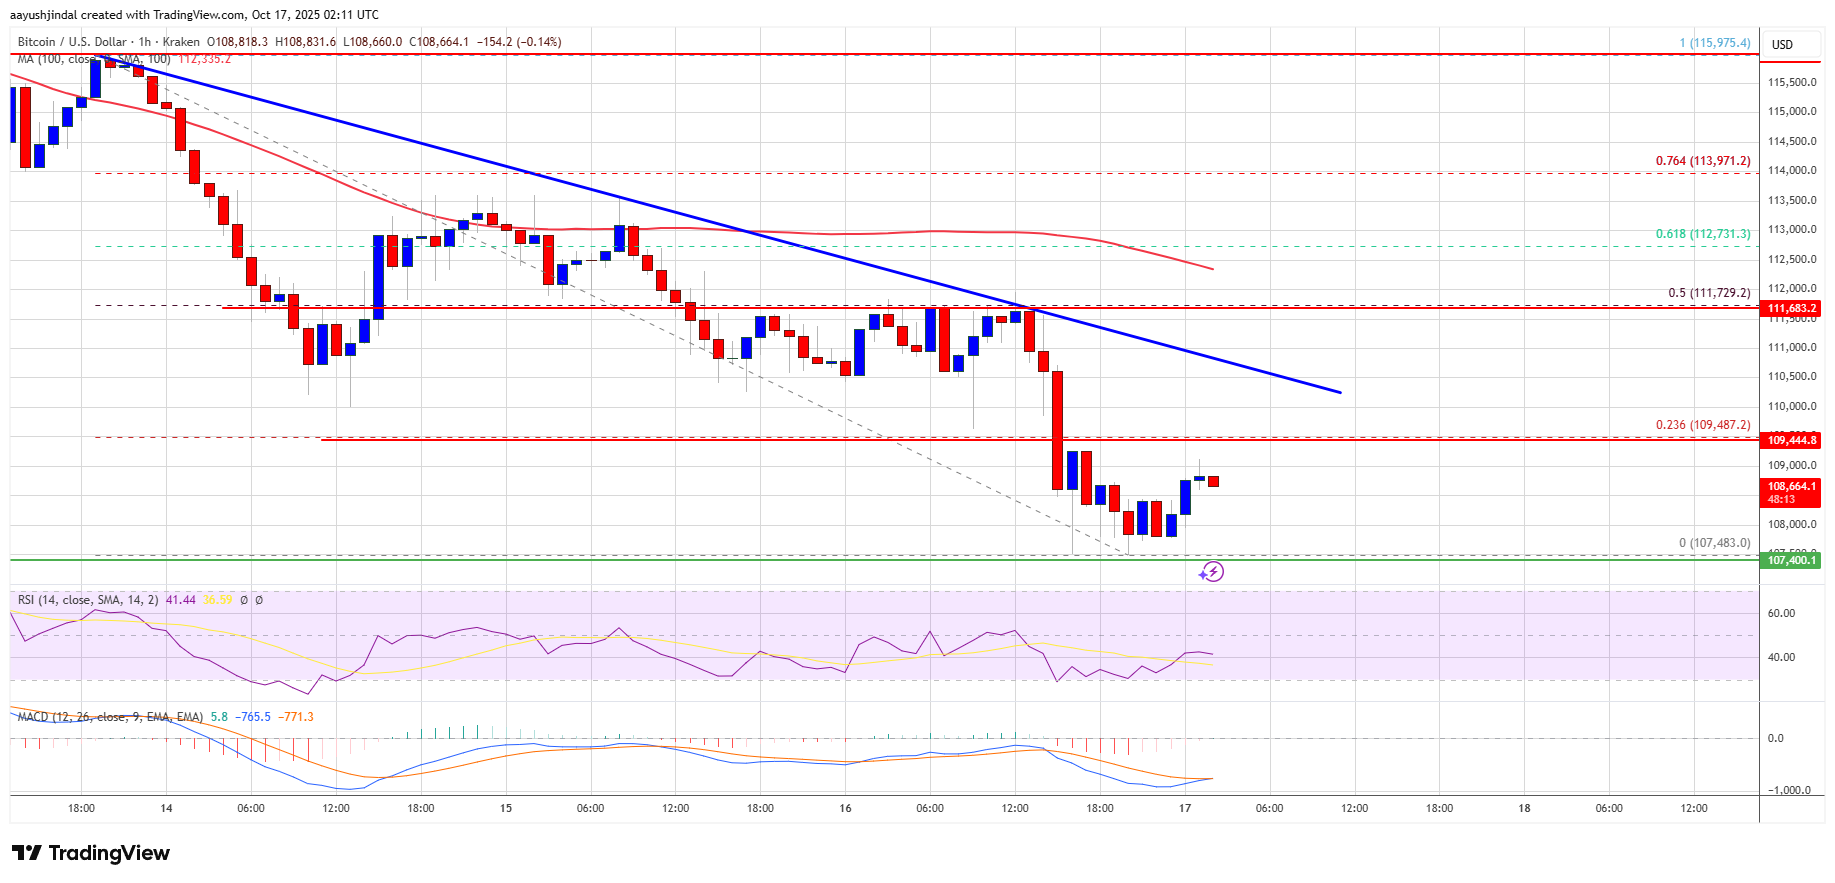
The first key resistance is near the $110,000 level. The next resistance could be $110,500 and the trend line. A close above the $110,500 resistance might send the price further higher. In the stated case, the price could rise and test the $111,800 resistance since it is close to the 50% Fib retracement level of the recent decline from the $115,975 swing high to the $107,483 low. Any more gains might send the price toward the $112,500 level. The next barrier for the bulls could be $113,000.
Another Decline In BTC?
If Bitcoin fails to rise above the $110,000 resistance zone, it could start a fresh decline. Immediate support is near the $108,000 level. The first major support is near the $107,500 level.
The next support is now near the $106,200 zone. Any more losses might send the price toward the $105,500 support in the near term. The main support sits at $103,200, below which BTC might struggle to recover in the short term.
Technical indicators:
Hourly MACD – The MACD is now gaining pace in the bearish zone.
Hourly RSI (Relative Strength Index) – The RSI for BTC/USD is now below the 50 level.
Major Support Levels – $108,000, followed by $107,500.
Major Resistance Levels – $110,000 and $110,500.


Vélemény, hozzászólás?