
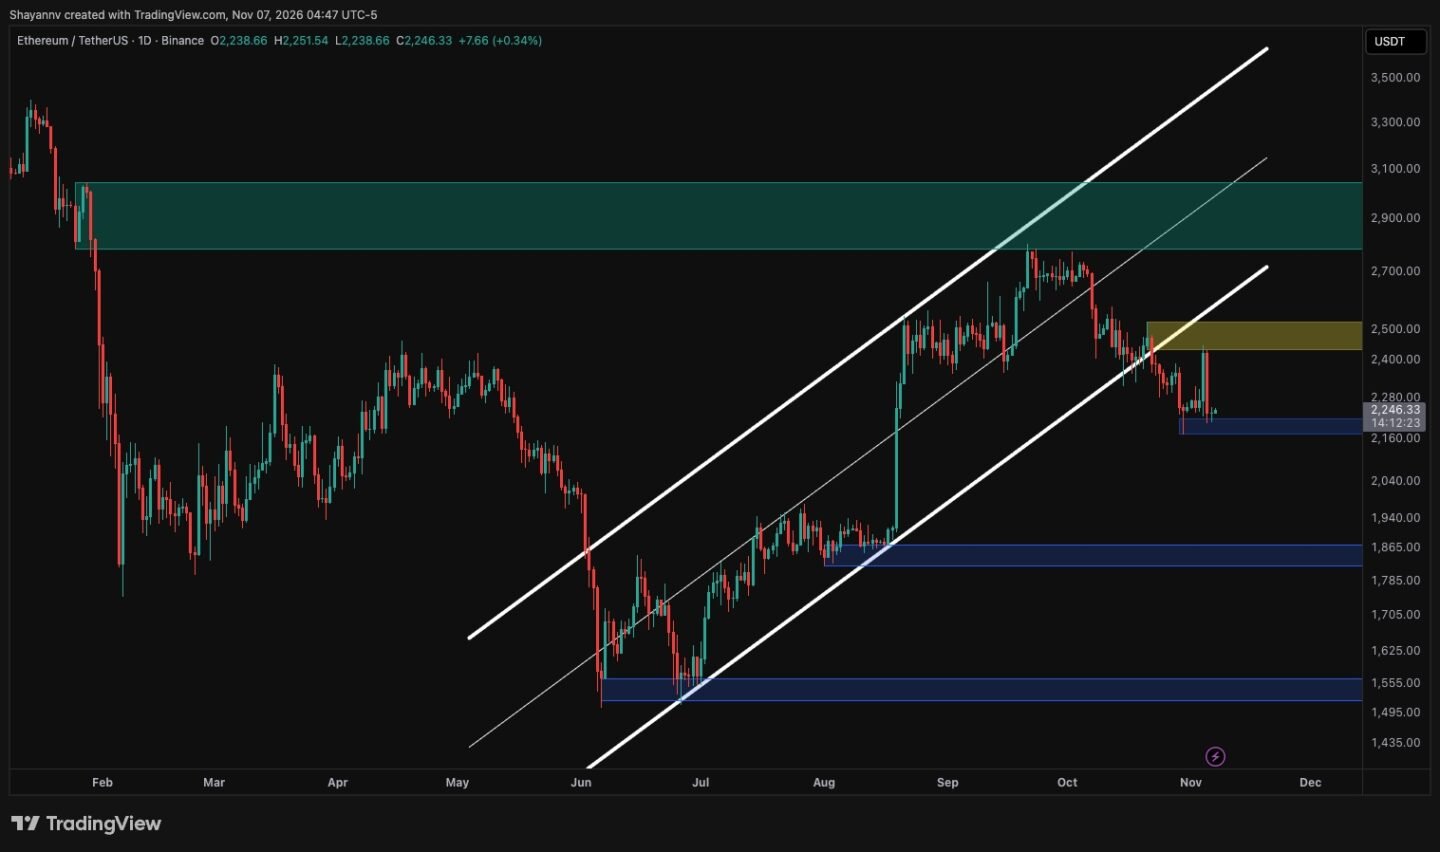
Ethereum is struggling to regain momentum after a failed breakout attempt earlier this week sent the price back toward $2.2K. With ETH now trading around $2.25K, buyers are defending a short-term support level that could decide whether the market stabilizes or extends its correction. Meanwhile, network activity between user wallets has dropped sharply from its mid-2026 highs, offering little sign of renewed demand.
Ethereum Price Analysis: The Daily Chart
Ethereum’s daily chart shows the asset breaking below the ascending channel that carried the price higher from the June lows near $1.5K. After topping out close to $2.8K in late September, ETH declined through the channel’s midpoint and eventually lost its lower boundary in late October. This indicates a clear deterioration in the medium-term structure.
The subsequent rebound retested the $2.5K supply zone, which now overlaps with the broken lower trendline, but sellers rejected the move. This reaction shows that this former support has turned into resistance. ETH is now holding the $2.2K support level, which marked the late-October low, and buyers would first need to reclaim $2.5K to restore the bullish case and bring the $2.8K-$3K supply zone back into view.
Conversely, a decisive daily close below $2.2K would confirm the channel breakdown and expose the $1.85K demand zone, the consolidation area that preceded the sharp August rally. Below that, the $1.5K region remains the major floor, as it formed the base of the entire recovery that began in June.
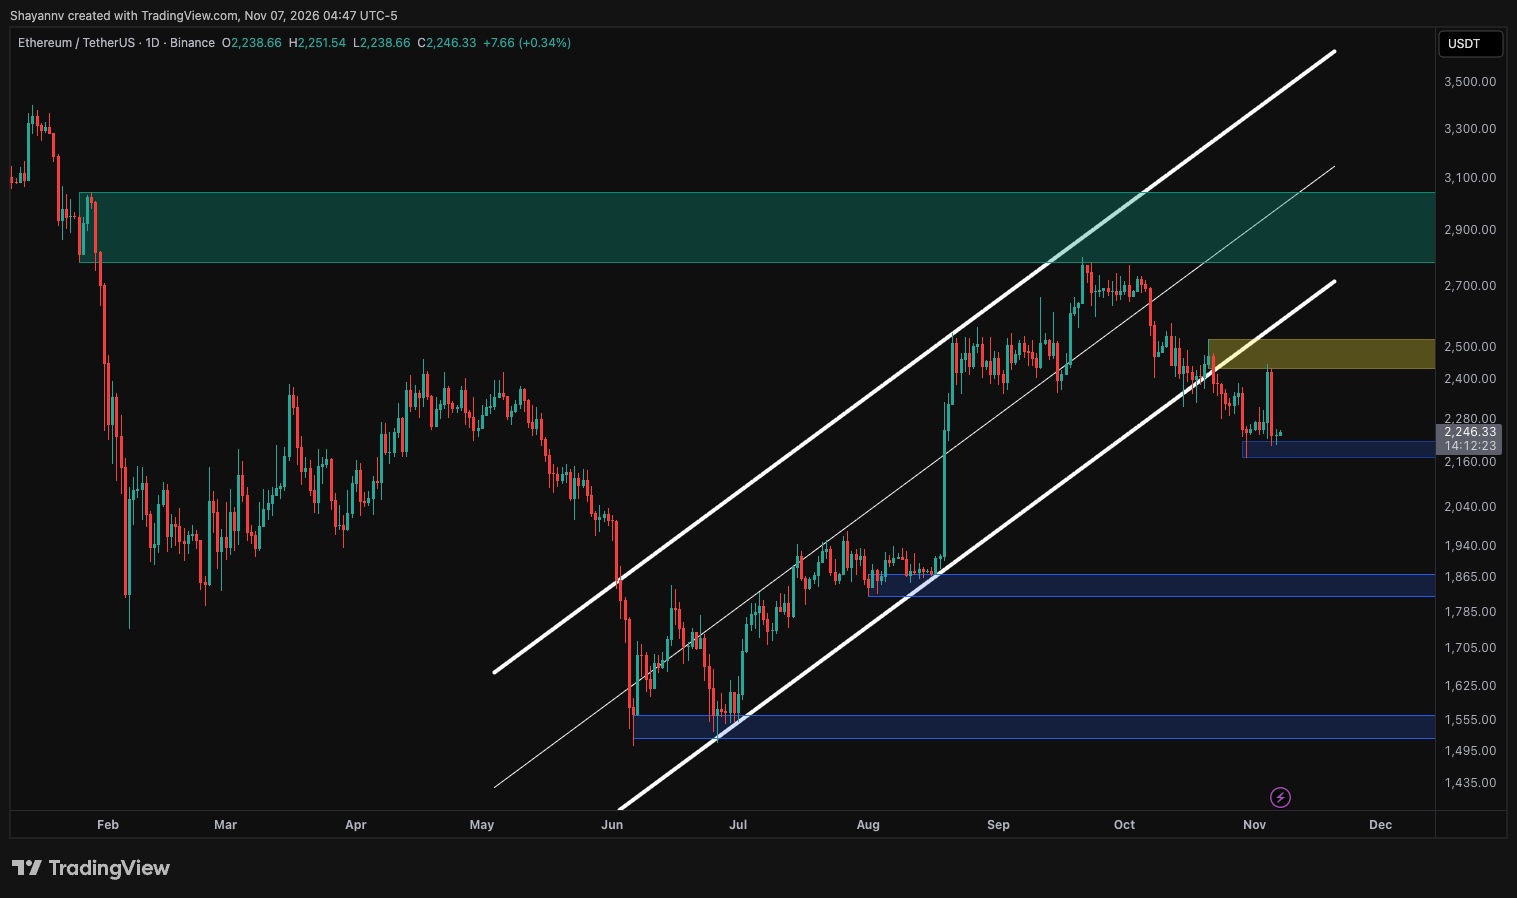
ETH/USDT 4-Hour Chart
The 4-hour chart shows ETH trading within a descending channel since early October, with a series of lower highs and lower lows. Earlier this week, the asset briefly pushed above the channel’s upper boundary and rallied toward $2.5K, but the move was quickly reversed by a sharp sell-off back inside the structure. This fake breakout trapped late buyers and reinforced the bearish short-term outlook.
ETH is now consolidating just above the $2.2K demand zone, which has already absorbed two sell-offs in the past weeks. If buyers continue to defend it, a relief bounce toward the upper channel boundary around $2.3K could follow. Reclaiming that trendline and then $2.5K would be required to invalidate the failed breakout and target the $2.7K order block.
On the other hand, a breakdown below $2.2K would likely push the price toward the channel’s lower boundary near $2K. Repeated tests of this support increase the risk of failure, and the short-term structure continues to favor sellers unless the upper trendline is decisively broken to the upside.

On-Chain Analysis
The Transactions Between EOA metric on CryptoQuant tracks the number of transfers between externally owned accounts, which are wallets controlled by private keys rather than smart contracts and exchanges. Its 30-day exponential moving average serves as a proxy for direct peer-to-peer usage of the network, with rising readings generally reflecting stronger user activity.
The indicator rose steadily from roughly 400K in 2024 to around 600K by late 2025, before surging toward 1.3M in the first half of 2026. Notably, this expansion occurred while ETH fell toward $1.5K, showing that activity and price do not always move in the same direction. It also showed a mass change of hands for ETH when the price lows were forming. Since August, the metric has collapsed to approximately 560K, close to its lowest levels of the past year, and is only now stabilizing.
This reading should be interpreted with caution, as transaction counts can be inflated or deflated by low-value automated transfers and fee conditions, and do not directly measure buying demand. Still, the sharp contraction in wallet activity, combined with the loss of the daily channel, suggests that the market lacks a strong catalyst. This leaves the $2.2K support level as the key line for buyers to defend.

Der Posten Ethereum Price Analysis: ETH Must Reclaim These Levels to Reverse Bearish Momentum erschien zuerst auf KryptoKartoffel.











 Deutsch
 English
 Română
 Eesti
 한국어
 日本語
 Русский
 Español
 简体中文
 Français
 繁體中文
 Português
 Italiano
 Polski
 Türkçe
 Nederlands
 Bahasa Indonesia
 Ελληνικά
 Українська
 Български
 Čeština
 Suomi
 Magyar
 Latviešu valoda
 Lietuvių kalba
 Norsk bokmål
 Slovenčina
 Slovenščina
 Svenska
Schreibe einen Kommentar