
Bitcoin price started a recovery wave from the $73,650 zone. BTC is consolidating and might struggle to clear the $76,500 resistance zone.
- Bitcoin managed to form a base above $74,000 and started a recovery wave.
- The price is trading above $75,000 and the 100 hourly simple moving average.
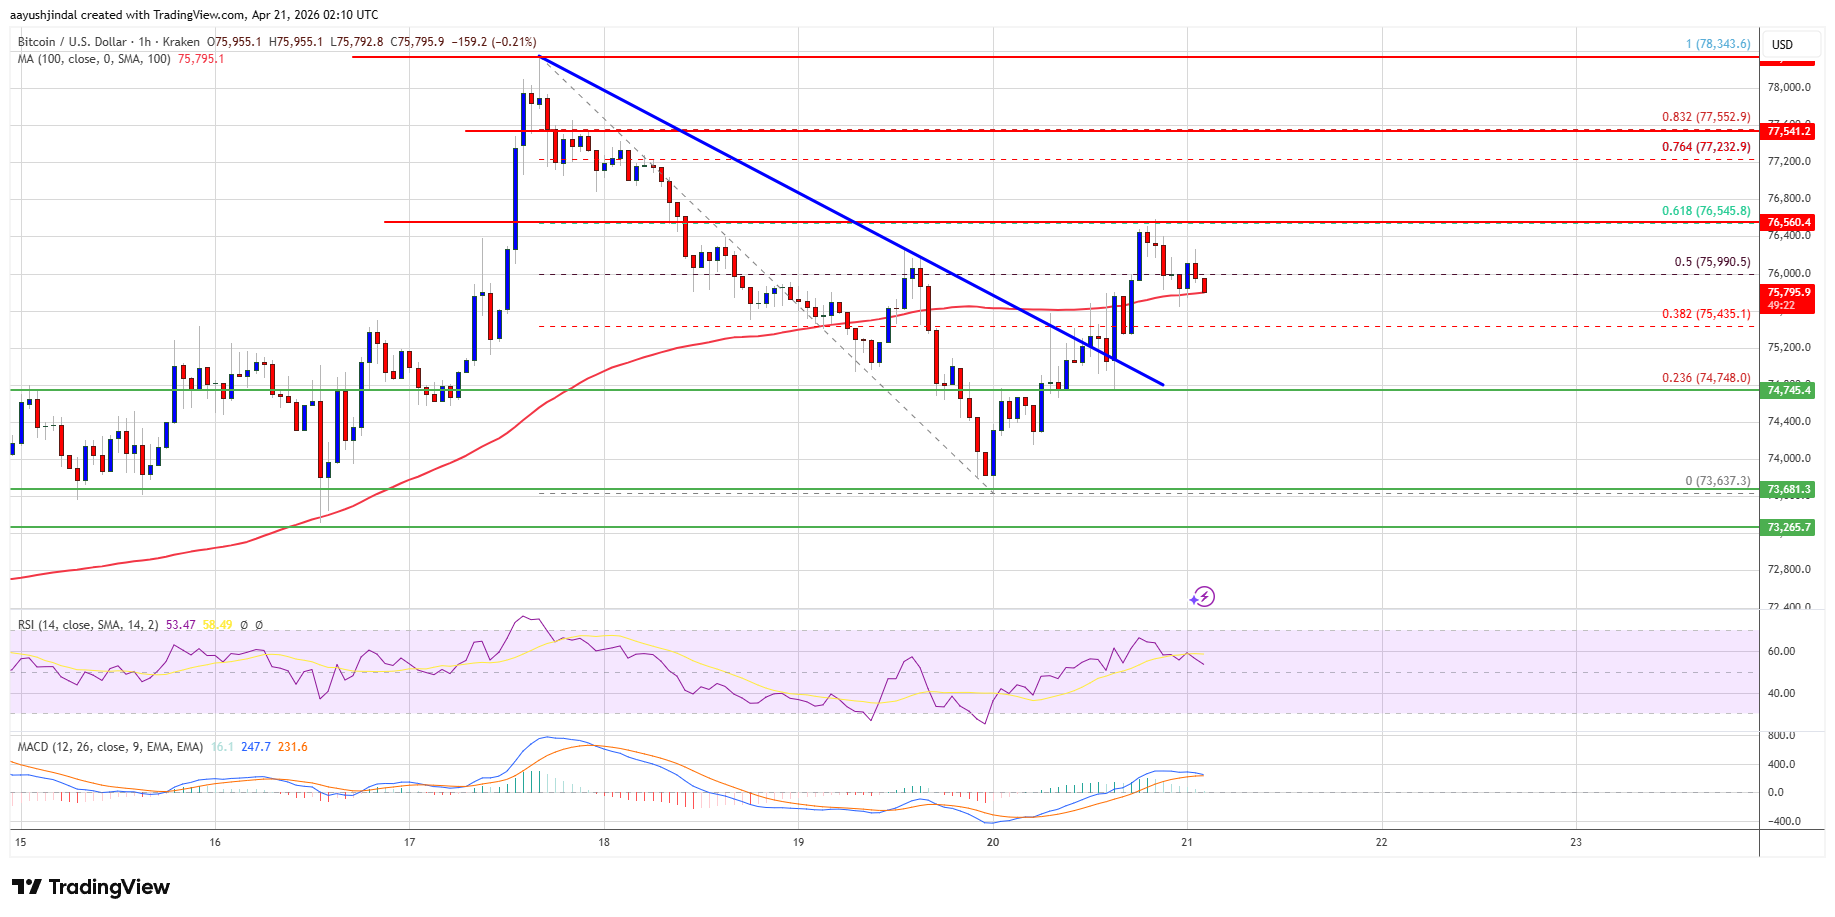
- There was a break above a bearish trend line with resistance at $75,200 on the hourly chart of the BTC/USD pair (data feed from Kraken).
- The pair might gain bullish momentum if it settles above the $76,500 zone.
Bitcoin Price Aims Higher
Bitcoin price extended losses below the $75,500 support zone. BTC even spiked below $74,000 before the bulls appeared. A low was formed at $73,637, and the price is now attempting to recover.
There was a move above the $74,500 and $75,000 levels. There was a break above a bearish trend line with resistance at $75,200 on the hourly chart of the BTC/USD pair. The pair even surpassed the 50% Fib retracement level of the downward move from the $78,344 swing high to the $73,637 low.
Bitcoin is now trading above $75,000 and the 100 hourly simple moving average. If the price remains stable above $75,000, it could attempt a fresh increase. Immediate resistance is near the $76,500 level and the 61.8% Fib retracement level of the downward move from the $78,344 swing high to the $73,637 low.
The first key resistance is near the $77,250 level. A close above the $77,250 resistance might send the price further higher. In the stated case, the price could rise and test the $78,000 resistance. Any more gains might send the price toward the $78,500 level. The next barrier for the bulls could be $80,000.
Another Decline In BTC?
If Bitcoin fails to rise above the $76,500 resistance zone, it could start another decline. Immediate support is near the $75,400 level.
The first major support is near the $75,000 level. The next support is now near the $74,250 zone. Any more losses might send the price toward the $73,650 support in the near term. The main support now sits at $72,000, below which BTC might struggle to recover in the near term.
Технически показатели:
Hourly MACD – The MACD is now losing pace in the bullish zone.
Hourly RSI (Relative Strength Index) – The RSI for BTC/USD is now moving lower toward the 50 level.
Major Support Levels – $75,000, followed by $74,250.
Major Resistance Levels – $76,500 and $77,250.


Вашият коментар