
BNB has been one of the strongest performers in recent weeks, standing out even as the broader crypto market struggles to find stability. During this market downturn, key metrics continue to validate BNB’s sustained momentum and network expansion. According to data shared by analyst CryptoOnchain, the BNB Smart Chain (BSC) reached a historic milestone on October 13th, recording 3.62 million daily active addresses — the highest in its history.
This surge in on-chain activity comes after months of steady price appreciation that began in June and accelerated rapidly after mid-September. The timing is notable: the spike in active addresses closely followed BNB’s price peak at $1,311 on October 8th, revealing a powerful correlation between network growth and market valuation.
The data suggests that as BNB’s price rose, it sparked heightened user engagement across the BSC ecosystem — possibly driven by increased trading activity, DeFi interactions, and retail FOMO. With the network now showing record participation, analysts are watching to see if this momentum can hold through the current correction. Sustained activity above these levels could reinforce market confidence and establish stronger structural support for BNB’s long-term trend.
BNB Network Data Shows Tight Correlation Between Price And On-Chain Activity
According to CryptoOnchain, recent 数据 shows that since September 2025, the relationship between BNB’s active addresses and its price has entered a new and more synchronized phase. Historically, these two indicators fluctuated independently — price rallies often occurred without a matching rise in network activity, and vice versa. However, over the past month, this pattern has shifted dramatically. The chart now shows the active addresses (green area) and the BNB price (yellow dashed line) moving almost in perfect tandem.

Interestingly, the BNB price peaked a few days before network activity, suggesting that the rally likely triggered a surge of user participation — a classic case of FOMO driving engagement across the BNB Smart Chain. This behavioral pattern often signals growing retail involvement and can reinforce bullish sentiment in the short term.
That said, recent data shows a modest cooldown. The BNB price has corrected to around $1,212, while daily active addresses have dropped slightly below 3 million. This pullback raises a key question: can the network sustain this elevated level of activity? Maintaining user engagement above the 3 million threshold could help establish a strong support zone for BNB’s price. Conversely, a significant drop in active addresses might indicate a local top and the beginning of a deeper correction.
BNB Price Tests Key Support After Sharp Correction
BNB is undergoing a significant pullback after weeks of strong performance. As shown in the chart, the price has dropped roughly 8.4%, closing near $1,049, marking one of the steepest single-day declines since early August. The correction follows a parabolic rally that peaked at $1,311, with current price action suggesting that the market is entering a consolidation phase.
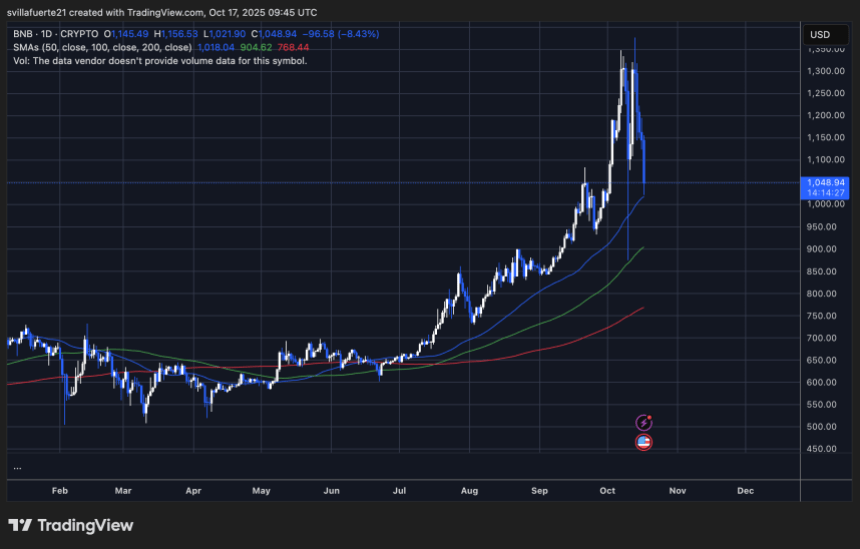
Despite the short-term drop, BNB remains structurally bullish as long as it holds above its 50-day moving average (currently near $1,018). This dynamic support aligns closely with the prior breakout zone from September, making it a crucial area to monitor. A decisive loss of this level could open the door for a deeper retracement toward $900, where the 100-day moving average sits.
The rapid ascent over the past two months likely triggered profit-taking among traders, as momentum indicators hinted at overextension. However, the longer-term trend remains intact, supported by the 200-day moving average rising steadily near $768. If BNB stabilizes above $1,000 and recovers momentum, the bulls could attempt another push toward the $1,200–$1,250 range. For now, maintaining the $1,000 psychological level is key to sustaining market confidence.
Featured image from ChatGPT, chart from TradingView.com


發佈留言