

Ethereum is trading within a tight range that has held for several weeks, forming the kind of compression structure that often leads to a significant breakout. Despite heightened volatility in global markets driven by escalating tensions in the Middle East, ETH has remained resilient, holding strong above key demand zones around the $2,500–$2,600 area. The current environment is marked by uncertainty, with geopolitical conflict and macroeconomic risks weighing on investor sentiment. Yet Ethereum’s price structure suggests that bulls are patiently building momentum.
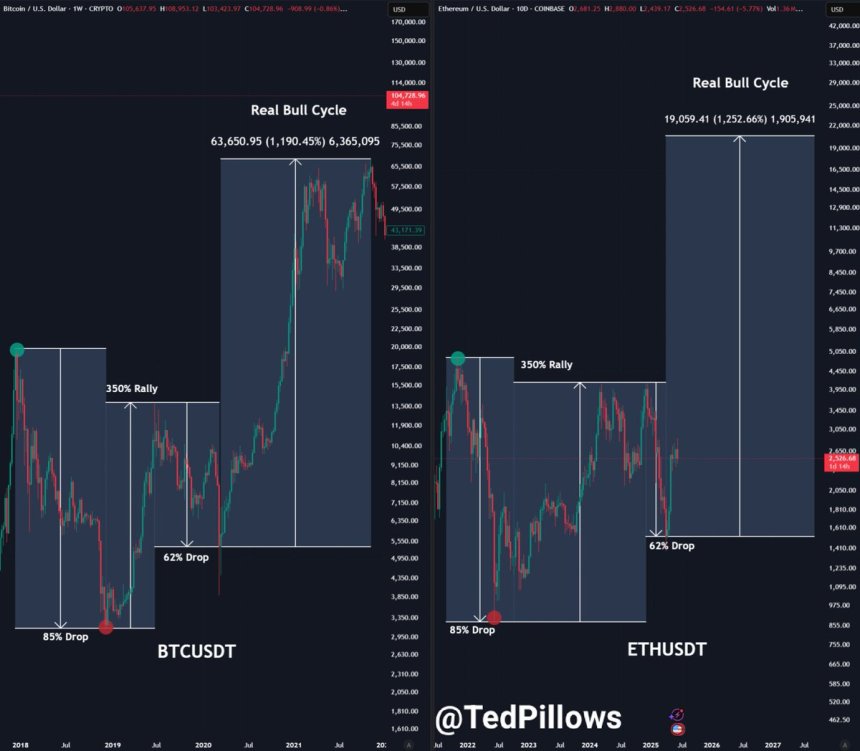
Top analyst Ted Pillows shared a technical outlook, pointing out that Ethereum is mirroring the same consolidation pattern that Bitcoin followed during its 2017–2021 cycle. In that historical setup, BTC compressed into a tight range before entering a parabolic rally once the upper boundary was broken. If Ethereum follows a similar path, the next move could be dramatic, especially if it clears major resistance levels like $2,800.
As long as ETH holds range support and absorbs both upside and downside wicks, this setup remains intact. A breakout above the current range could ignite a fresh leg up for Ethereum—and possibly spark renewed strength across the altcoin market.
Ethereum Builds Momentum As Market Awaits Clarity
Ethereum is currently trading in a tight range, consolidating just above the $2,600 level and holding firm despite macroeconomic and geopolitical headwinds. After rallying nearly 80% from its April lows, ETH appears to be preparing for a decisive move in the coming sessions. However, with escalating tensions between Israel and Iran and uncertainty surrounding possible U.S. involvement, broader markets remain cautious. Until clarity emerges on the geopolitical front, sideways price action may persist.
Still, Ethereum’s price structure remains constructive. Strong consolidation above key demand zones reflects ongoing buyer interest and a lack of heavy selling pressure. This behavior often precedes major moves, as investors accumulate ahead of expected volatility. Some market participants remain cautious, warning of a possible retrace below the $2,400 level if demand falters or broader risk sentiment weakens.
In contrast, bullish analysts like Ted Pillows suggest a more optimistic outlook. According to Pillows, Ethereum is closely following the path Bitcoin took during its 2017–2021 cycle, where tight consolidation ultimately led to a breakout and parabolic rally. In this view, ETH’s real explosive phase won’t begin until it breaks above $4,000. If this scenario plays out, Ethereum could trigger a broader altcoin surge and shift overall crypto market sentiment bullish once again.
ETH Technical Analysis: Consolidation Near Key Levels
The 3-day Ethereum chart shows a prolonged consolidation phase as ETH trades near the $2,500 mark. Despite geopolitical uncertainty and rising macroeconomic risks, Ethereum has held above the $2,400 support zone, forming a tight range just below the critical resistance at $2,775. This area also coincides with the 200-day SMA (red line), which continues to cap upward momentum.
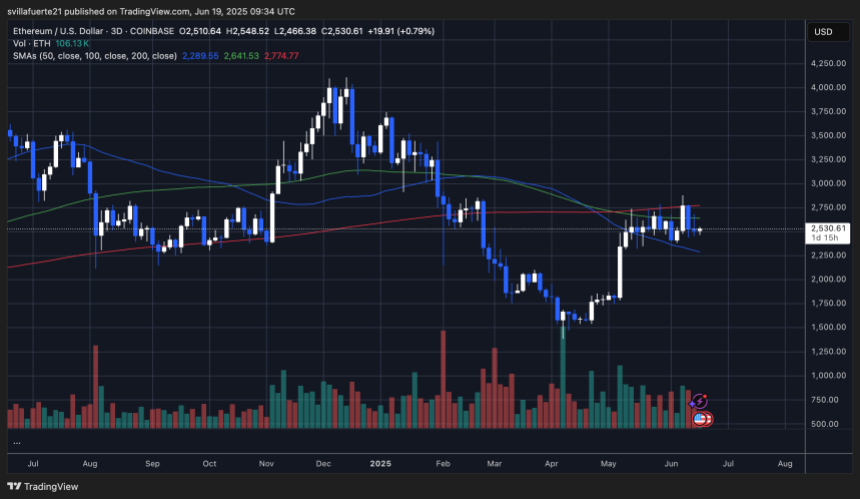
ETH remains above the 50-day (blue) and 100-day (green) SMAs, suggesting bullish momentum is intact, though lacking follow-through. The recent candle bodies show decreasing volatility, with wicks on both sides being absorbed—a classic sign of compression that often precedes a large move.
Related Reading: Ethereum Golden Cross Approaching – Will History Repeat?
Volume has declined slightly compared to the breakout in early May, indicating a temporary pause in bullish conviction. However, if Ethereum manages a higher close above the $2,775 resistance, it could trigger an impulsive breakout targeting the $3,000 level. On the downside, a break below $2,400 would invalidate the current structure and expose ETH to a deeper correction toward $2,100.
Featured image from Dall-E, chart from TradingView












 繁體中文
繁體中文  English
  Română
  Eesti
Eesti  한국어
한국어  日本語
日本語  Русский
  Deutsch
  Español
  简体中文
简体中文  Français
  Português
  Italiano
  Polski
  Türkçe
  Nederlands
  Bahasa Indonesia
  Ελληνικά
  Українська
  Български
  Čeština
  Suomi
Suomi  Magyar
  Latviešu valoda
  Lietuvių kalba
  Norsk bokmål
  Slovenčina
  Slovenščina
  Svenska
發佈留言