
Bitcoin’s recent price action may be showing its first signs of relief as a closely watched indicator tied to US demand has just changed direction. The Coinbase Premium Gap has moved back into positive territory following nearly 10 weeks of persistent negative readings, a stretch that coincided with Bitcoin’s decline from around $95,000 to below $65,000 in February.
Coinbase Premium Turns Positive
The Coinbase Premium Gap, which measures the price difference between Bitcoin on Coinbase, the primary exchange for US-based institutional and retail investors, and its price on offshore platforms such as Binance, stayed in negative territory for the entirety of Bitcoin’s correction from $95,000 to the mid-$60,000 range.
Whenever the Coinbase Premium Gap is negative, it usually means that traders in the United States are selling Bitcoin at a faster pace than buyers are stepping in. A positive gap indicates the opposite dynamic of demand from US investors pushing Coinbase prices higher relative to the price in the global market.
Notably, the metric entered a sustained negative zone on January 1 and held there through March 7, which is a period during which US spot demand was largely absent among crypto investors
At its worst, the gap reached -175 on February 2, coinciding with the most severe phase of Bitcoin’s price crash. At the time of writing, the Coinbase Premium Gap has now turned positive, registering a reading of +25.4 according to data shared by CryptoQuant analyst @IT_TECH_PL. The reversal of the Coinbase Premium Gap from a low of -175 to a positive reading is the first step in a meaningful change in market structure.
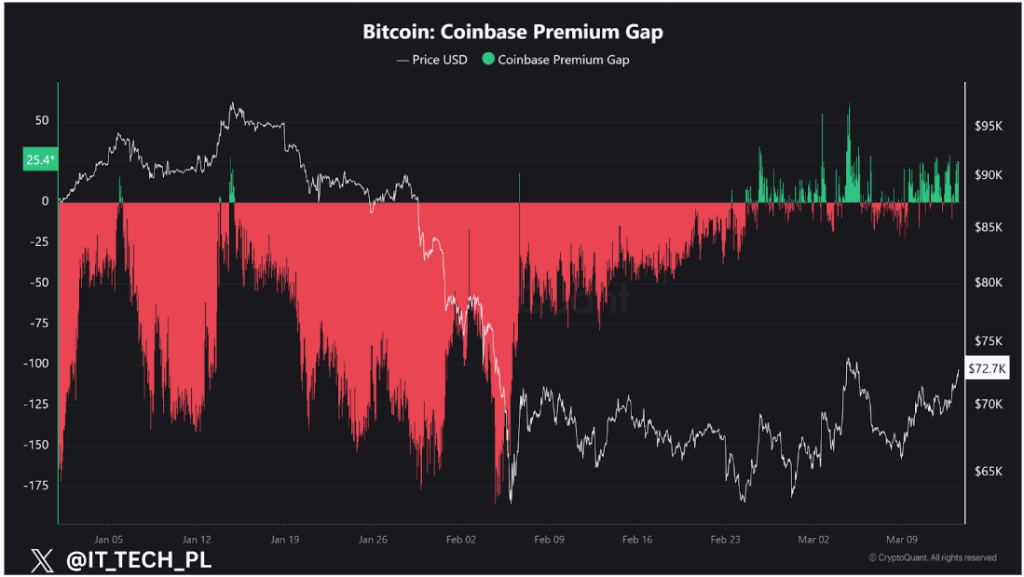
Chart Image From X. Source: @IT_TECH_PL
The current reading, while still early and modest relative to the depth of the prior negative regime, is the first consistent sign that American spot demand may be returning to Bitcoin. It shows that those same participants may be slowly accumulating Bitcoin again compared to the rest of the world. However, the broader structure of Bitcoin’s price action still leaves room for further downside before the formation of a definitive bottom.
Bitcoin Could Still Drop To $50,000 Before Bottom
Although a few on-chain signals are slowly turning constructive, a few analysts are cautious before declaring the broader correction over. A technical analysis from crypto analyst Ted Pillows points to a longer-term technical indicator that has always coincided with Bitcoin bottoms.

According to his observation, the last two major bear-market lows occurred below the 300-week exponential moving average (300W EMA). In both cases, Bitcoin fell more than 15% beneath the indicator before the final bottom was established.
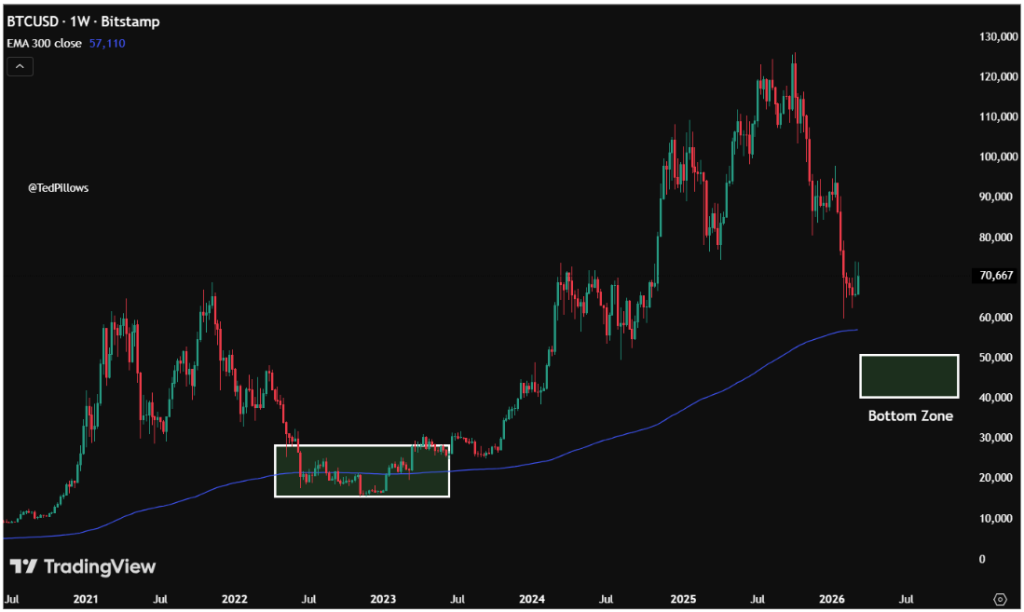
Bitcoin Price Chart. Source: @TedPillows On X
Bitcoin’s 300-week EMA is currently around $57,100. Applying the same pattern would imply a possible move to around $50,000, which would represent a decline of roughly 15% below the indicator. Nonetheless, this projection does not guarantee that Bitcoin will revisit that level before forming a bottom.
精选图片来自 Pexels,图表来自 TradingView


发表回复