
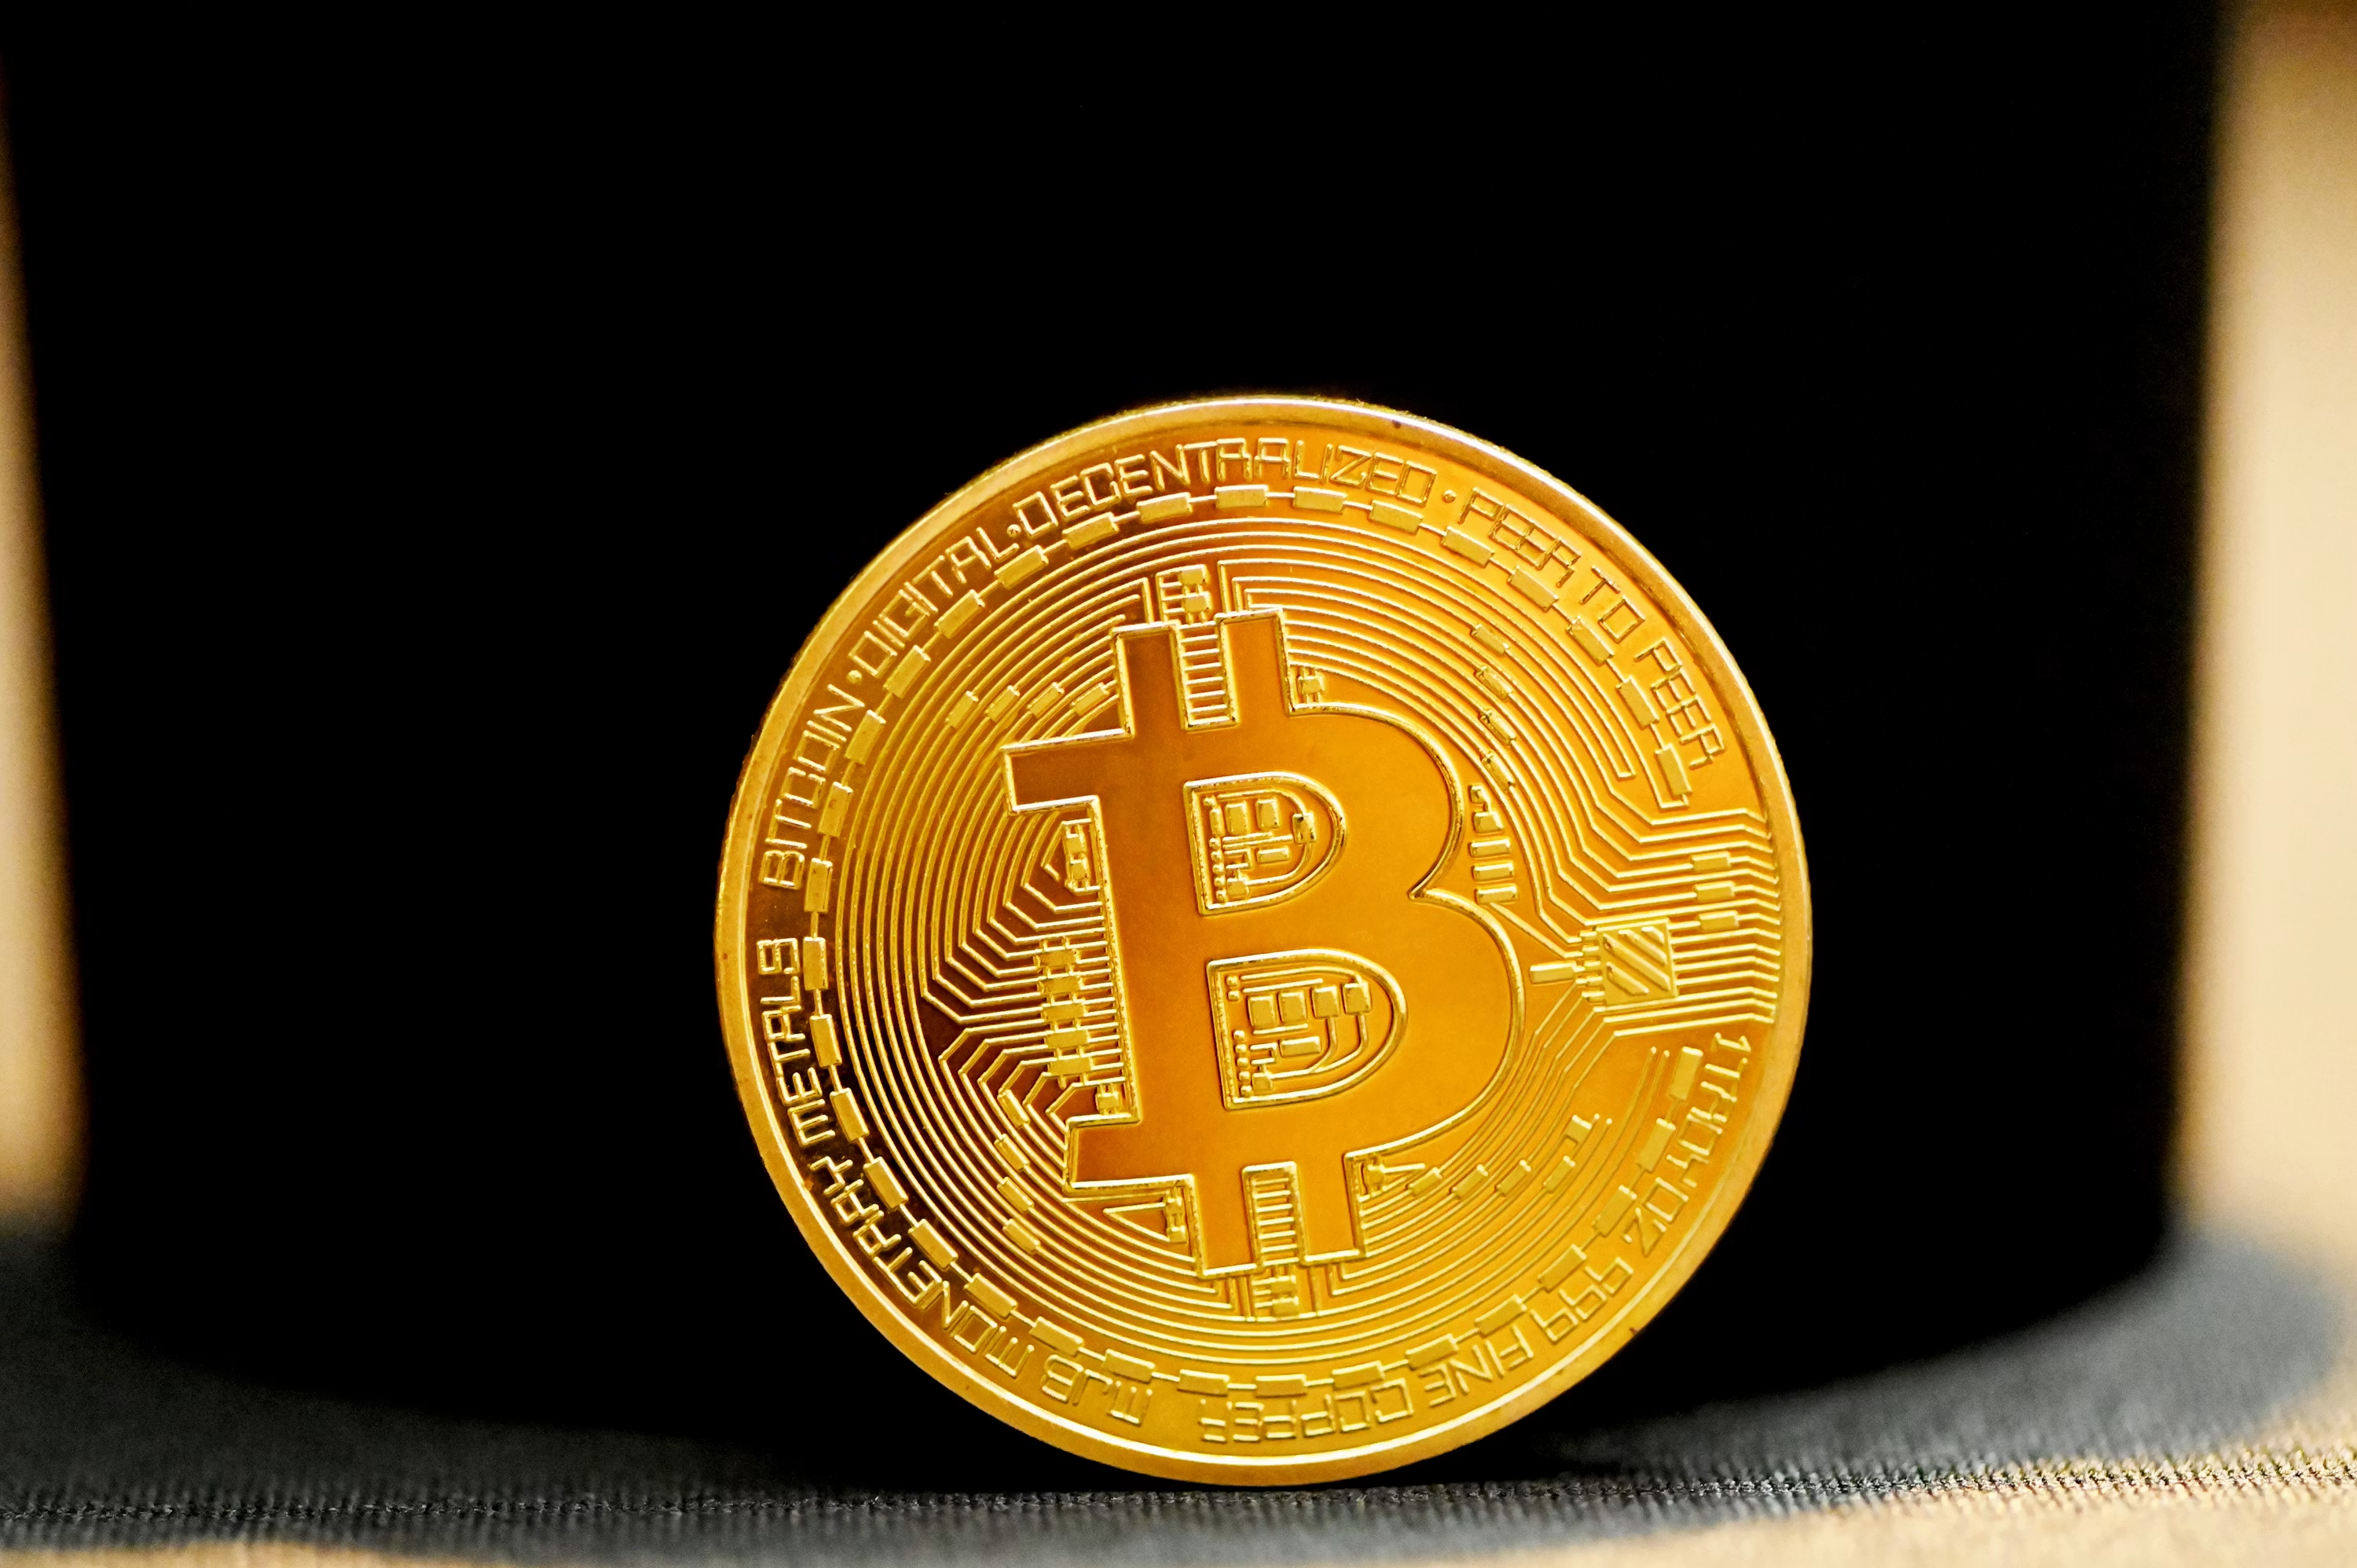
XRP could fall another 59% to 62% against Біткойн before finding solid ground, according to technical analysis shared by chart analyst Chart Nerd.
That target sits in the 0.0000071 to 0.0000065 range on the XRP/BTC pair, a level that has historically drawn buyers back into the market.
A Pattern Of Lower Highs
The XRP/BTC pair has been printing lower highs since 2017 — nearly a decade of consistent underperformance against Bitcoin.
Each recovery attempt has fallen short of the previous one, with peak readings near 0.000097 in January 2019 giving way to 0.0000426 in November 2020, then 0.0000390 in May 2021, followed by 0.0000297 in July 2023, and most recently 0.0000257 in January 2026 — all stopped out beneath a long-running descending resistance line.
I’m sorry to break this to my $XRP community. i’m just tired of the constant hopium: we have been underperforming #Bitcoin since 2017, with NO signs of any major rotation. In fact, over the last 3 months, BTC has climbed 60K-80K while $XRP/BTC has lost its 20 MEMA. Back to green. https://t.co/24IB42ZWsW pic.twitter.com/CeJibNhoMx
-
ChartNerd
 ChartNerd
  (@ChartNerdTA)
Despite the consistent pattern, XRP has not been completely left behind in dollar terms. Reports indicate the token climbed 37% from its February low of $1.12 to a May high of $1.54, a recovery that looks respectable on its own.
But measured against Bitcoin, that move failed to hold above the 20-month exponential moving average, a sign analysts read as weakness.
Capital Staying In Bitcoin
Bitcoin gained 38% over the past three months, rising from a yearly low of $60,000 to $82,800. XRP did not keep pace on the BTC trading pair, and Chart Nerd says that tells a bigger story about where money is flowing.

When major tokens like XRP trail Bitcoin during a rally, it typically signals that investors are staying put in Bitcoin rather than rotating into altcoins. Capital either holds in BTC or exits the sector altogether, based on Chart Nerd’s analysis.
One area of relative strength remains. The XRP/BTC pair has approached what Chart Nerd labels a historical outperformance zone on multiple occasions, and buyers have consistently stepped in near those levels each time.
Weak Structure, Longer-Term Hope
Chart Nerd’s outlook is not entirely negative on XRP. Higher prices are still expected for the token over the long run, though the analyst sees it continuing to lag Bitcoin through most of 2026.
Other analysts share a cautious view. Top chartist Ali Martinez has flagged a possible drop to the $0.73 region for XRP if selling pressure continues to build.
Featured image from Unsplash, chart from TradingView












 Українська
  English
  Română
  Eesti
Eesti  한국어
한국어  日本語
日本語  Русский
  Deutsch
  Español
  简体中文
简体中文  Français
  繁體中文
繁體中文  Português
  Italiano
  Polski
  Türkçe
  Nederlands
  Bahasa Indonesia
  Ελληνικά
  Български
  Čeština
  Suomi
Suomi  Magyar
  Latviešu valoda
  Lietuvių kalba
  Norsk bokmål
  Slovenčina
  Slovenščina
  Svenska
Залишити відповідь