
XRP is trading around $2.47 at press time. The asset has gained 5% over the past 24 hours, though it remains 5% lower on the week.
Analysts are tracking key price levels, historical signals, and trading behavior, suggesting that XRP may be entering a new phase of market structure.
Price Holds Long-Term Demand Area
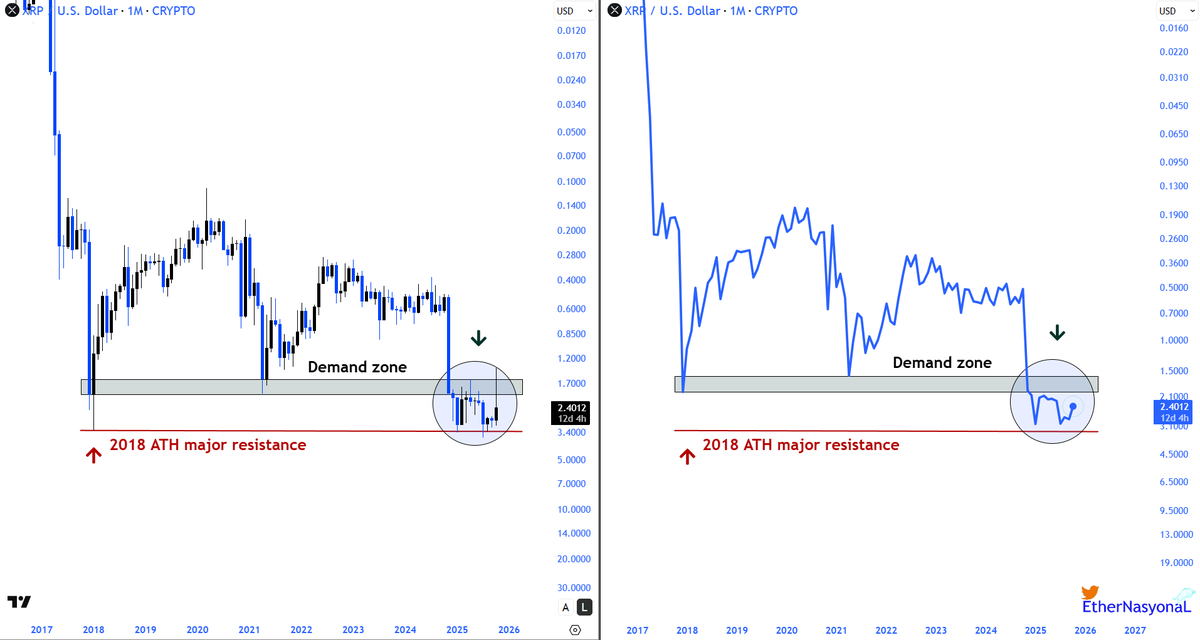
Well-known trader and analyst EtherNasyonaL shared a long-term view of XRP using an inverted monthly chart to highlight structural patterns. The chart focuses on a demand zone that stems from the 2018 all-time high resistance. This area is now acting as support.
XRP has traded within this range for several months. The chart shows repeated tests of the lower boundary without any breakdowns. The analyst said XRP is “gathering strength” and that “the next major move is being prepared to the upside.” In the non-inverted view, the structure resembles a rounded bottom, often linked to trend reversals.
Six-Month Chart Points to Higher Targets
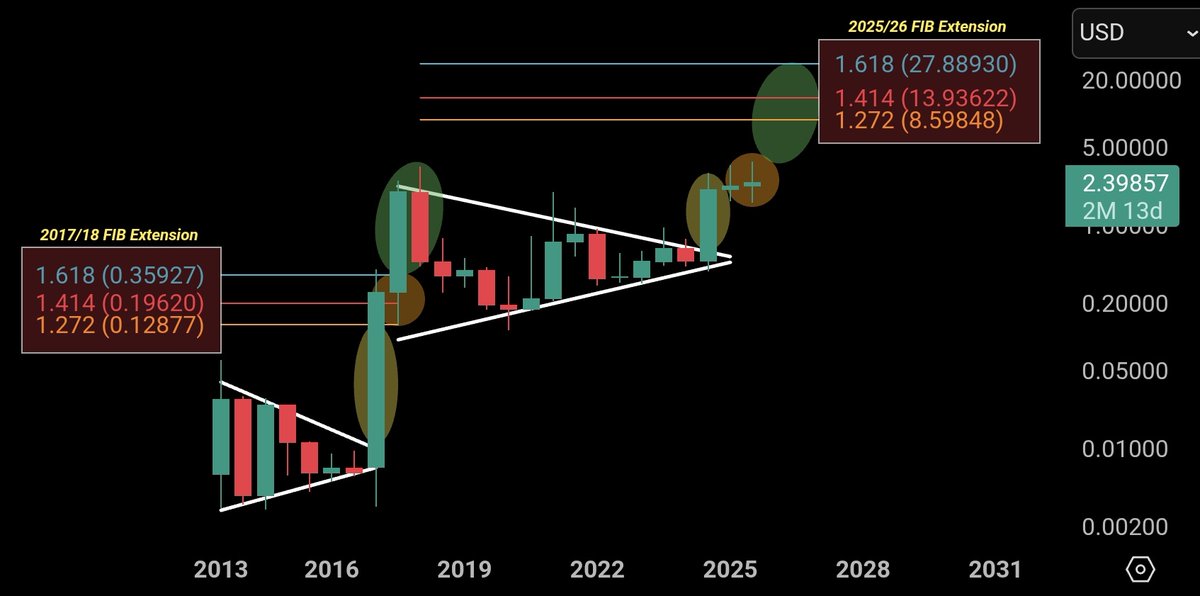
Another analyst, ChartNerd, presented a six-month candle chart using Fibonacci extensions to outline the next potential stages for XRP. Despite a recent upper wick, the chart shows no change in trend. Higher lows and higher highs remain in place.
Interestingly, the analysis points to price levels at $5, $8.59, $13.93, and $27.88 as potential targets, based on past cycles and extension levels. According to the post, the structure does not show any signs of a breakdown and still favors continuation.
Sentiment Hits Lowest Point of the Year
Steph Is Crypto reviewed XRP’s short-term holder Net Unrealized Profit and Loss (NUPL). The chart shows that short-term holders have reached deep negative territory, dropping to -0.20. This level is lower than any other on the chart over the past year.
Previous dips into this “capitulation” zone, seen in October 2024, March 2025, and June 2025, all occurred near market lows. The analyst explained that these events have consistently marked bottoms and warned,
“This is absolutely the worst time to exit.”
In addition, a recent chart from Cryptoinsightuk mapped XRP liquidity zones on the daily timeframe. The most active area is between $2.20 and $2.80, which has held as support. Above current levels, liquidity builds near $3.00 to $3.40, which could be tested if price moves up.
Meanwhile, CryptoPotato rapor edildi that wallets holding over 10,000 XRP have reached an all-time high of 317,500. This trend has continued for nearly a year, with a brief pause in late 2024. Analysts note that the current pattern aligns with a possible Wave 4 consolidation under Elliott Wave Theory.
Gönderi Ripple (XRP) Price Predictions: Rally to $5 or a Crash to $2, What’s Next? ilk olarak şurada yayınlandı CryptoPotato.


Bir yanıt yazın