Dogecoin’s price action is working on a rebound after hitting $0.222 in the past 24 hours. Zooming out into a larger timeframe shows the price structure on the weekly timeframe is pointing to an explosive breakout is in the making. Technical analysis shows that the meme coin, which has already shown it can deliver extraordinary rallies, is now sitting on a powder keg that will send it to new all-time highs. Particularly, technical projections indicate that if the current trend continues, Dogecoin could surge to $1.30.
Pattern Repetition Points To $1.3 Target
Bu first interesting chart observation focuses on how Dogecoin rallies unfold in repeating waves of expansion. This analysis, which was posted on the social media platform X by
Kamran Asghar, shows how Dogecoin has been following a repeating structure in the weekly candlestick timeframe chart.
In late 2023, the Dogecoin price broke out of consolidation with a 300% surge, followed by another wave in 2024 that delivered a 500% rally from trendline support to resistance. Each cycle began with a bounce from the ascending white trendline shown on the weekly chart below, which has consistently acted as the backbone of Dogecoin’s long-term uptrend.
Now, the pattern is setting up for what could be an 800% rally, highlighted in the green projection box on the chart below. This move, if completed, would see the Dogecoin price rallying past its current all-time high of $0.7316 and finally breaking above the $1 price level. Particularly, the projection puts Dogecoin rallying more than 800% to reach a price target around $1.30.
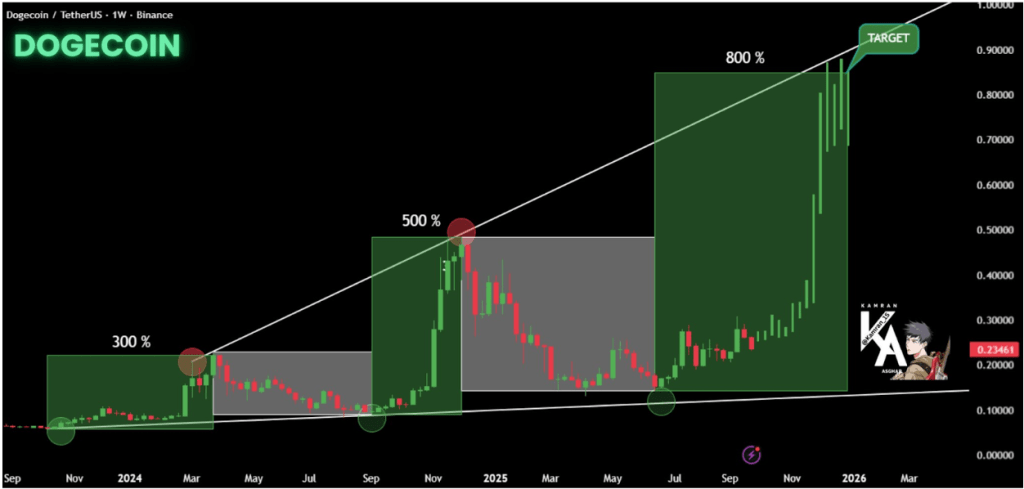
Chart Image From X: Kamran Asghar
Dogecoin Bullish Channel Still Intact Since 2021
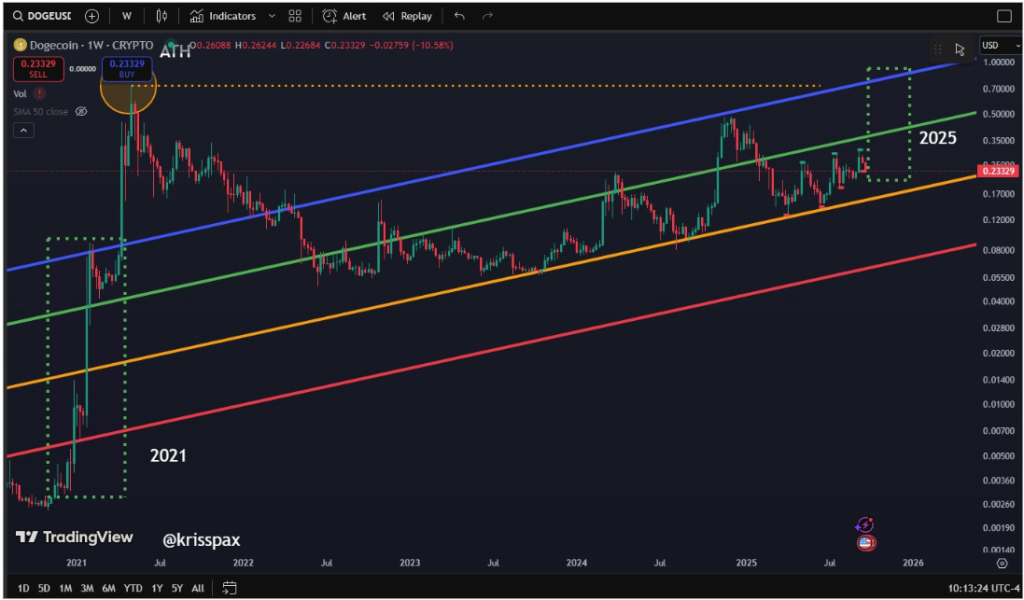
Another technical analysis looks at a broader view of Dogecoin’s performance over the last four years. Price action on the weekly timeframe is plotted within a colored channel system, starting from the 2021 breakout, as shown in the chart below. The lower orange line has consistently acted as support, while the green midline has worked as a pivot point. Lastly, the upper blue line is serving as resistance.

At the time of writing, Dogecoin is trading around $0.23, and this is just between the green midline and the orange support, meaning the bullish structure is still playing out. According to analyst KrissPax, who posted the technical analysis on the social media platform X, Dogecoin is still on track to keep moving to the upper band of the channel, which is marked in blue. Reaching this upper band would put the meme coin in the $0.70 to $1.00 range and retesting its all-time high in 2021. However, in this case, the first step would be to break above the green midline, which is currently around $0.4.
Meanwhile, Dogecoin is trading at $0.23, up by 1.1% in the past 24 hours. Investors are awaiting the SEC’s approval of a Spot Dogecoin ETF.
Featured image from Pixabay, chart from TradingView


Bir yanıt yazın