
A new technical analysis on TradingView suggests Bitcoin may be approaching a decisive moment, with a possible breakdown below key support levels. This analysis comes amidst a weakening buying pressure in Bitcoin, which opens up the possibility of a break below a strong support level. If this happens, Bitcoin could see further downside to $80,000 or even $73,000 in the coming weeks.
Bitcoin Faces Critical Support Test At $93,000
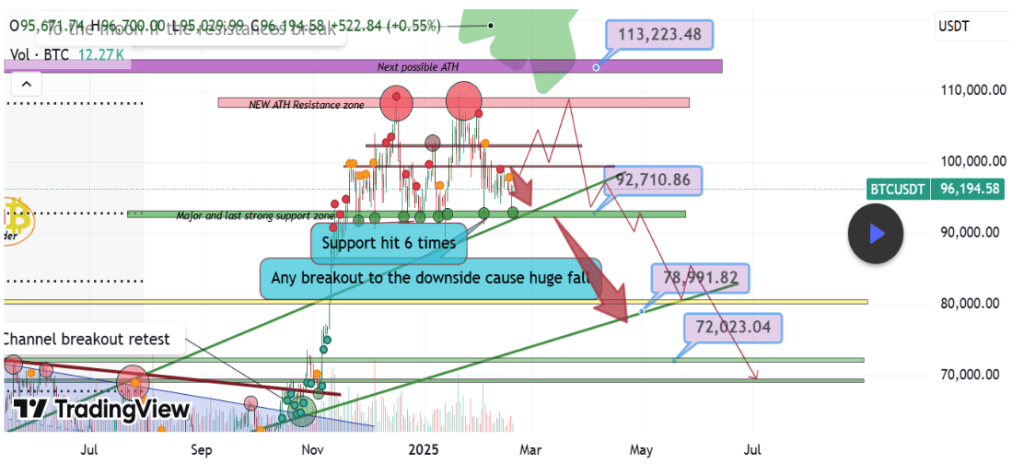
Technical analysis shows that Bitcoin has been fluctuating between an upper resistance zone at $108,000 and a lower support level at $93,000. Particularly, crypto analyst MMBTtrader noted that this support zone has been tested multiple times, six times to be exact since the Bitcoin price started trading within this range. Such multiple retests are expected to have weakened this support zone, as the buyers can as well give up very soon.
The most recent test occurred on February 18, when Bitcoin rebounded at $93,900, just above the key $93,000 level. However, Bitcoin has yet to establish a decisive recovery from this zone, and there is still a possibility of a full breakdown. Particularly, the analyst pointed out that the likelihood of a drop below $93,000 support has increased with momentum fading from buyers.
A swift break below $93,000 could cause a continued downside move, and it opens up a decline to the next significant support level around $72,000, although there is a minor support level at $78,900 that could prevent this drastic fall. Interestingly, this bearish scenario aligns with previous analyses that pointed out a lack of strong support within a $12,000 range between $87,000 and $75,000.
Bitcoin At A Crossroads: Breakdown Or New Highs?
The technical analysis by MMBTtrader sheds light on Bitcoin’s current market structure, which is a phase of consolidation rather than outright bearishness. Although recent developments indicate signs of bearish developments, Bitcoin has yet to shift into a fully bearish mode.

Instead, the current price action only suggests a period of indecision, where both bullish and bearish scenarios are possible. The repeated retests of the $93,000 support could cause a strong breakdown, but at the same time, a renewed wave of buying momentum could also spark a rally above $100,000.
The analyst also noted a scenario of Bitcoin picking up buying momentum and catapulting off the $93,000 support level. If the $93,000 support level holds, Bitcoin may gain momentum for another rally toward a new all-time high. In this scenario, the analyst highlighted a rally towards a new all-time high target zone around $113,220.
At the time of writing, Bitcoin is trading at $96,470, down by 2% in the past 24 hours. It is also down by 11.5% from its all-time high of $108,786.
Featured image from Pixabay, chart from TradingView


Bir yanıt yazın