
XRP price started a decent increase above $3.00 zone. The price is now facing resistance at $3.10 and might correct some gains in the near term.
- XRP price is attempting to start a fresh increase above the $3.00 zone.
- The price is now trading above $2.980 and the 100-hourly Simple Moving Average.
- There was a break below a bullish trend line with support at $3.065 on the hourly chart of the XRP/USD pair (data source from Kraken).
- The pair could start another increase if it stays above the $2.920 zone.
XRP Price Faces Resistance
XRP price started a fresh increase above the $2.820 zone, beating Bitcoin and Ethereum. The price was able to surpass the $2.920 and $2.950 resistance levels.
The price even cleared the $3.00 resistance level. Finally, the bears appeared near the $3.10 zone. A high was formed at $3.106 and the price is now correcting gains. There was a break below a bullish trend line with support at $3.065 on the hourly chart of the XRP/USD pair.
The price is now trading above $3.00 and the 100-hourly Simple Moving Average. It is also above the 23.6% Fib retracement level of the upward move from the $2.730 swing low to the $3.106 high.
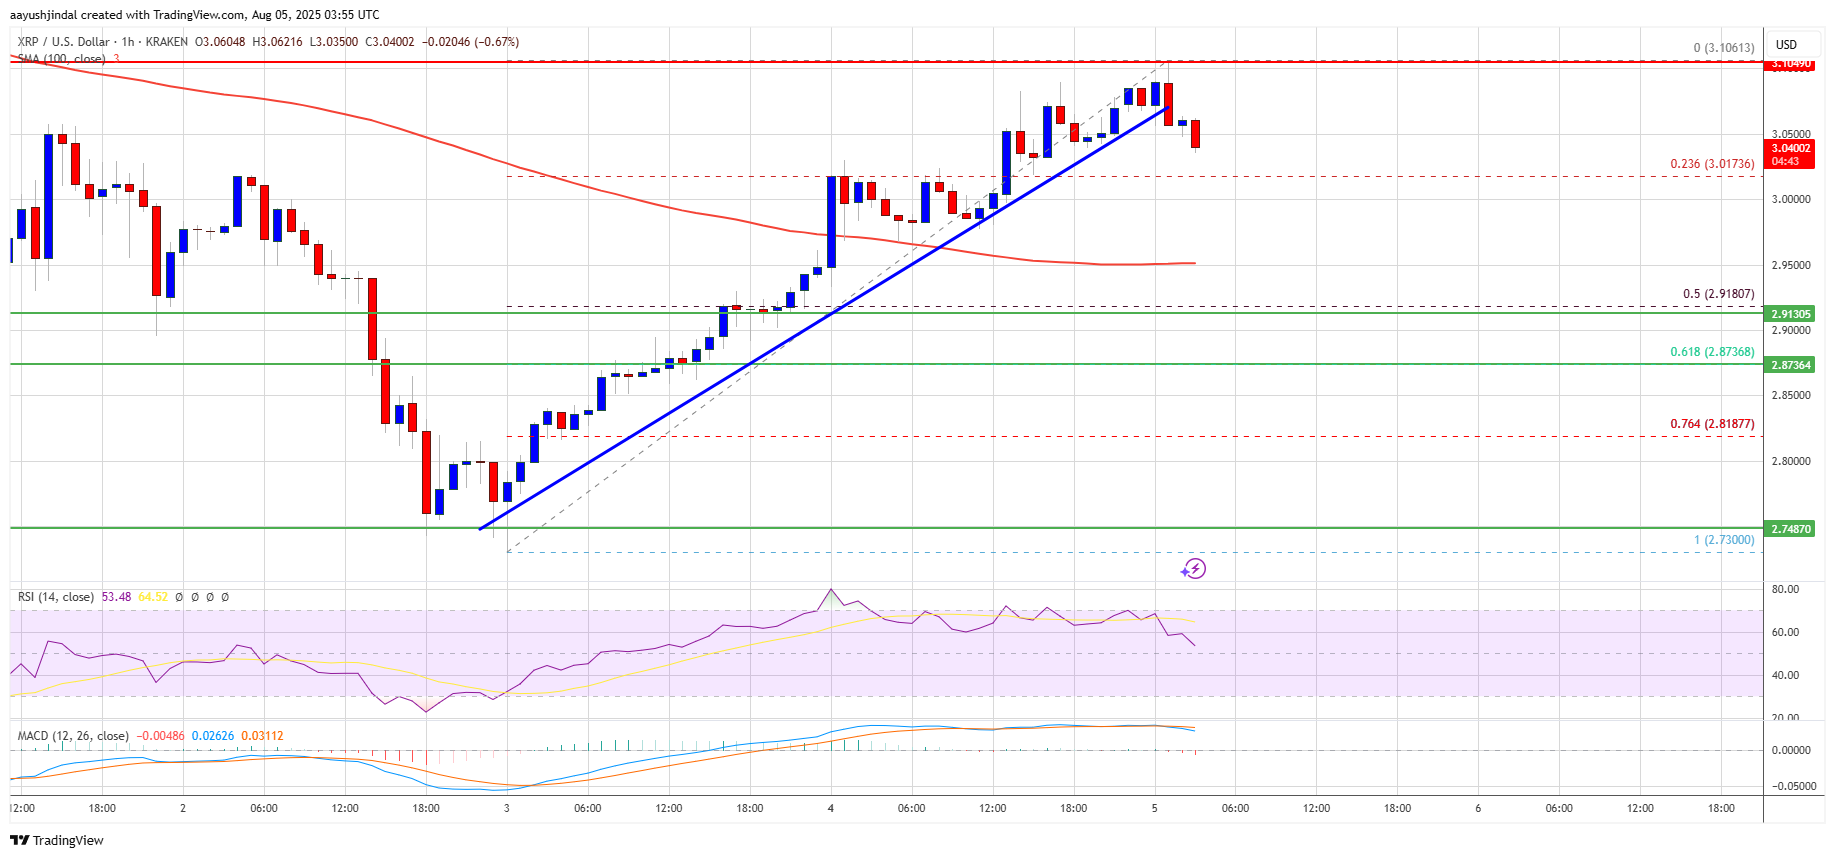
On the upside, the price might face resistance near the $3.10 level. The first major resistance is near the $3.120 level. A clear move above the $3.120 resistance might send the price toward the $3.150 resistance. Any more gains might send the price toward the $3.20 resistance or even $3.2120 in the near term. The next major hurdle for the bulls might be near the $3.250 zone.
Another Drop?
If XRP fails to clear the $3.10 resistance zone, it could start another decline. Initial support on the downside is near the $3.00 level. The next major support is near the $2.950 level.
If there is a downside break and a close below the $2.950 level, the price might continue to decline toward the $2.920 support and the 50% Fib retracement level of the upward move from the $2.730 swing low to the $3.106 high. The next major support sits near the $2.880 zone where the bulls might take a stand.
Technical Indicators
Hourly MACD – The MACD for XRP/USD is now losing pace in the bullish zone.
Hourly RSI (Relative Strength Index) – The RSI for XRP/USD is now above the 50 level.
Major Support Levels – $3.00 and $2.920.
Major Resistance Levels – $3.10 and $3.120.


Dodaj odgovor