
Ethereum is about to enter into a new week, coming off of a week of interesting price action that saw it trading at its highest price levels since 2021. On one hand, the Spot Ethereum ETFs that had driven billions in inflows have just recorded their first daily outflow in over a week. On the other hand, order-book data shows a towering sell wall at $4,800 that could be described as Ethereum’s “final boss,” the level that could unlock a parabolic run if broken.
ETF Inflows Break: Sentiment Cooling Down?
The optimism around Ethereum’s rally cooled just as the week came to a close. Notably, US-based Spot ETH ETFs reported net outflows of $59.34 million on August 15, effectively ending an eight-day streak that had added $3.7 billion in inflows.
The reversal came just as Ethereum failed to clear $4,788, a level within 3% of its all-time high of $4,878, before slipping back to about $4,450. Although BlackRock’s ETHA stood out with $338.09 million in daily inflows, Grayscale’s ETHE and Fidelity’s FETH registered notable withdrawals of $101.74 million and $272.23 million.
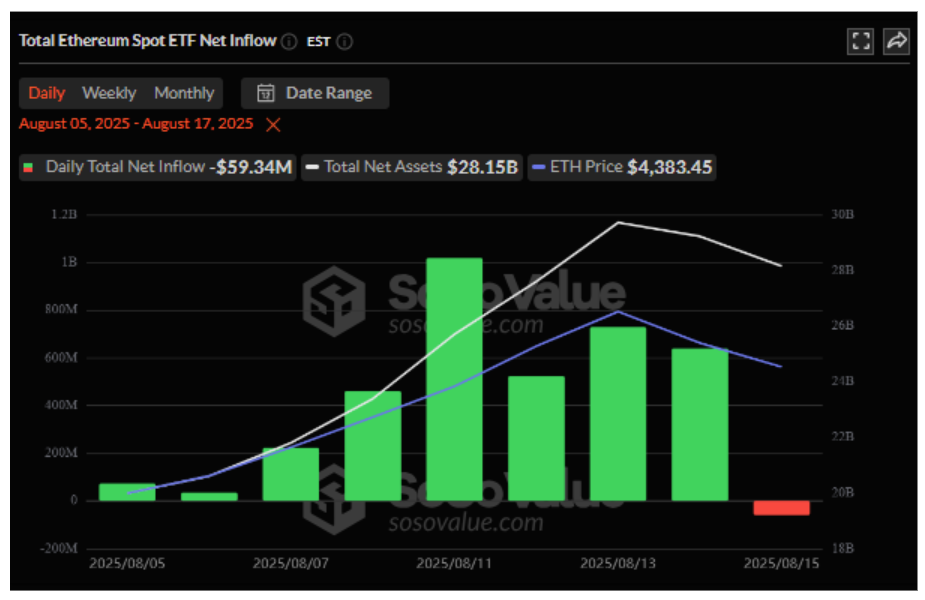
Total Ethereum Spot ETF Net Inflow: SoSoValue
Speaking of Ethereum failing to clear $4,788, on-chain data shows a huge cluster of liquidity around this level. Particularly, Merlijn The Trader described the $4,800 as the “final boss” for ETH, pointing to billions in sell orders stacked at that level on Binance’s ETH/USDT pair.
A liquidity heatmap shows a massive concentration of asks in this zone. According to the analyst, breaking above this level could unleash open skies for Ethereum. As long as this level is filled with more asks, there’s a possibility of it acting as a resistance for any upward move. However, clearing this fortress with enough buy volume would not just be a technical breakout but a psychological one, with the potential to push its price to new all-time highs.
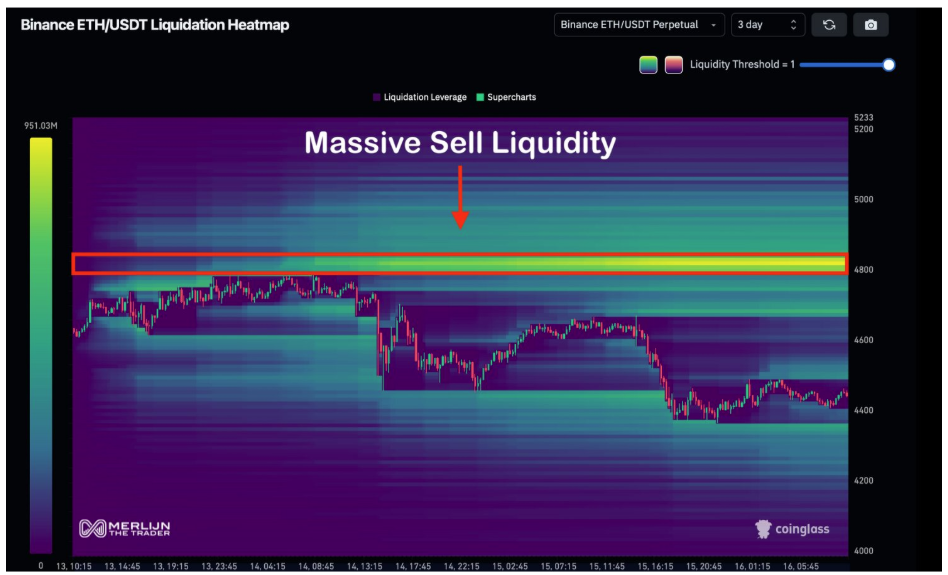
Image From X: Merlijn The Trader
Bearish Retracement Scenario
Although the liquidity narrative is currently leaning more towards a bullish breakout than bearish, another analysis from TradingView paints a more cautious picture. The analysis, which is based on the 4-hour candlestick timeframe chart, also identifies the $4,700 to $4,800 region as a supply-heavy resistance where Ethereum has already shown signs of exhaustion after an aggressive rally from early August.

However, multiple technical alignments, such as Break of Structure signals, fair value gaps (FVG), and Fibonacci retracements, show that Ethereum may be due for a retracement. The trade plan outlined anticipates an entry around $4,440, with a stop loss above $4,790 and a downside target of $3,375 at a strong support area. This would imply a corrective move of over 20% if the bearish projection plays out.
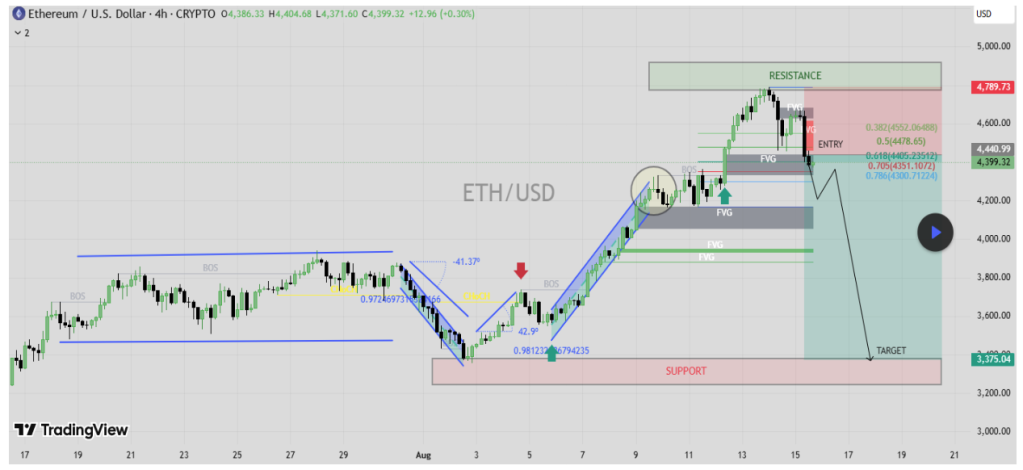
At the time of writing, Ethereum was trading at $4,465.
Featured image from Unsplash, chart from TradingView


Dodaj odgovor