
The Dogecoin weekly chart structure may be setting up for a classic Elliott Wave “third wave” advance, according to trader and market commentator Cantonese Cat (@cantonmeow), who argued that DOGE has reclaimed a critical Fibonacci level and could be transitioning from corrective price action into a new impulsive leg.
Dogecoin Set For Takeoff As Wave 3 Kicks In
Sharing a weekly chart, the analyst napisal: “Initially I thought DOGE wave 2 retraced to 0.5 of wave 1, which is valid, but it decided to get to 0.382 which is also possible for a wave 2 retracement. Now it’s reclaiming 0.618 and wave 3 could be starting… and wave 3 is the most bullish and most powerful of them all.”
The chart posted by Cantonese Cat applies a Fibonacci grid to Dogecoin’s 2022–December 2024 advance (“Wave 1” on the graphic), with the 0.618 retracement anchored around ~$0.20088 on the weekly timeframe and the mid-range levels marked at 0.5 (~$0.15350) and 0.382 (~$0.11729).
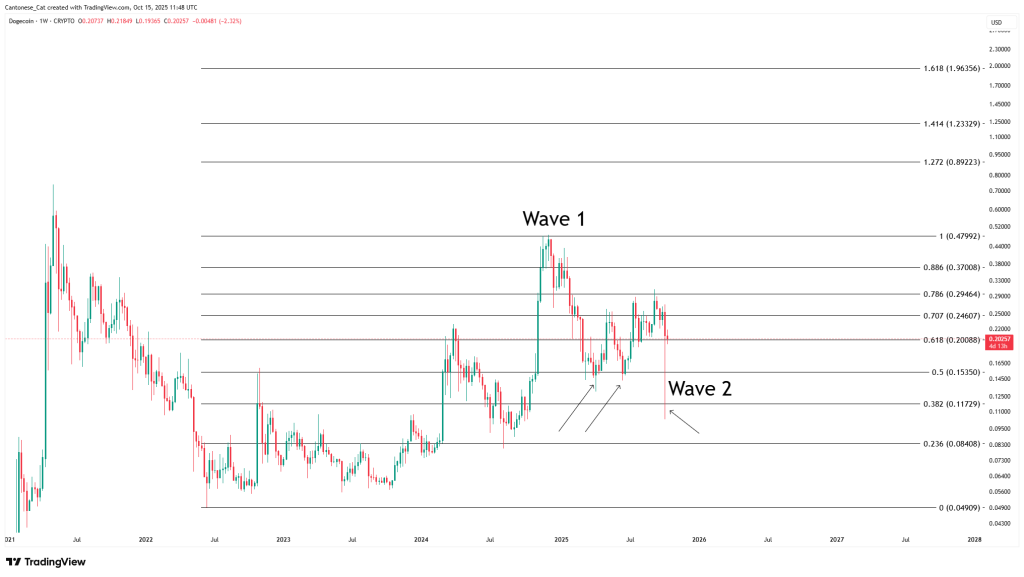
On the left axis, historical weekly candles show DOGE’s earlier cycle blow-off followed by a lengthy basing period near the ~$0.05–$0.10 zone (the 0.0 line sits at ~$0.04909), from which the advance began in mid-2022.
Elliott Wave analysis proposes that markets trend in a five-wave impulse where the third wave is typically the strongest by both breadth and momentum. Within that framework, a “Wave 2” pullback frequently terminates in the 0.382–0.618 retracement band of Wave 1, while a decisive reclaim of the 0.618 level on higher timeframes is often treated by technicians as a structural pivot back in favor of the prevailing uptrend.
The chart Cantonese Cat shared labels the recent decline as “Wave 2,” with wicks probing toward the 0.382 band and subsequent weekly closes gravitating back toward the 0.618 level. The current weekly candle plotted on the image sits almost exactly on that 0.618 line, indicating the market is testing whether buyers can convert it into support.
The analyst’s emphasis on the 0.618 reclaim is consistent with how many systematic traders translate Fibonacci confluence into risk frameworks: closes and acceptance above the golden-ratio band raise the probability that the prior impulse has resumed, whereas sustained rejection there often keeps a market locked in a range.
DOGE Price Targets
The chart also visualizes potential topside waypoints should momentum expand. The Fibonacci projections drawn beyond the “Wave 1” peak display the 1.0 band at roughly $0.48 and classical extensions at 1.272 (~$0.89), 1.414 (~$1.23), and 1.618 (~$1.96). Elliott practitioners frequently monitor these zones for acceleration targets or distribution risk if a third wave unfolds.
For now, the operative claim is straightforward and testable on chart: “Now it’s reclaiming 0.618 and wave 3 could be starting,” with the reminder that “wave 3 is the most bullish and most powerful of them all.” Whether price can hold above the ~$0.20088 pivot into weekly close and then demonstrate impulsive breadth—rising range, expanding volume, and leadership versus peers—will determine if this setup matures into the kind of third-wave advance Elliott theorists anticipate or fades back into consolidation.
At press time, DOGE traded at $0.20.


Dodaj odgovor