Ethereum remains under significant pressure across higher and lower timeframes after losing several major technical levels in quick succession. While the recent rebound from the local bottom around $1.5K has provided some short-term relief, the broader structure still favors sellers unless ETH can reclaim a series of key resistance zones overhead.
Moreover, the rising put/call ratio suggests increasing caution and demand for downside hedging among options participants, rather than growing bullish exposure.
Ethereum Price Analysis: The Daily Chart
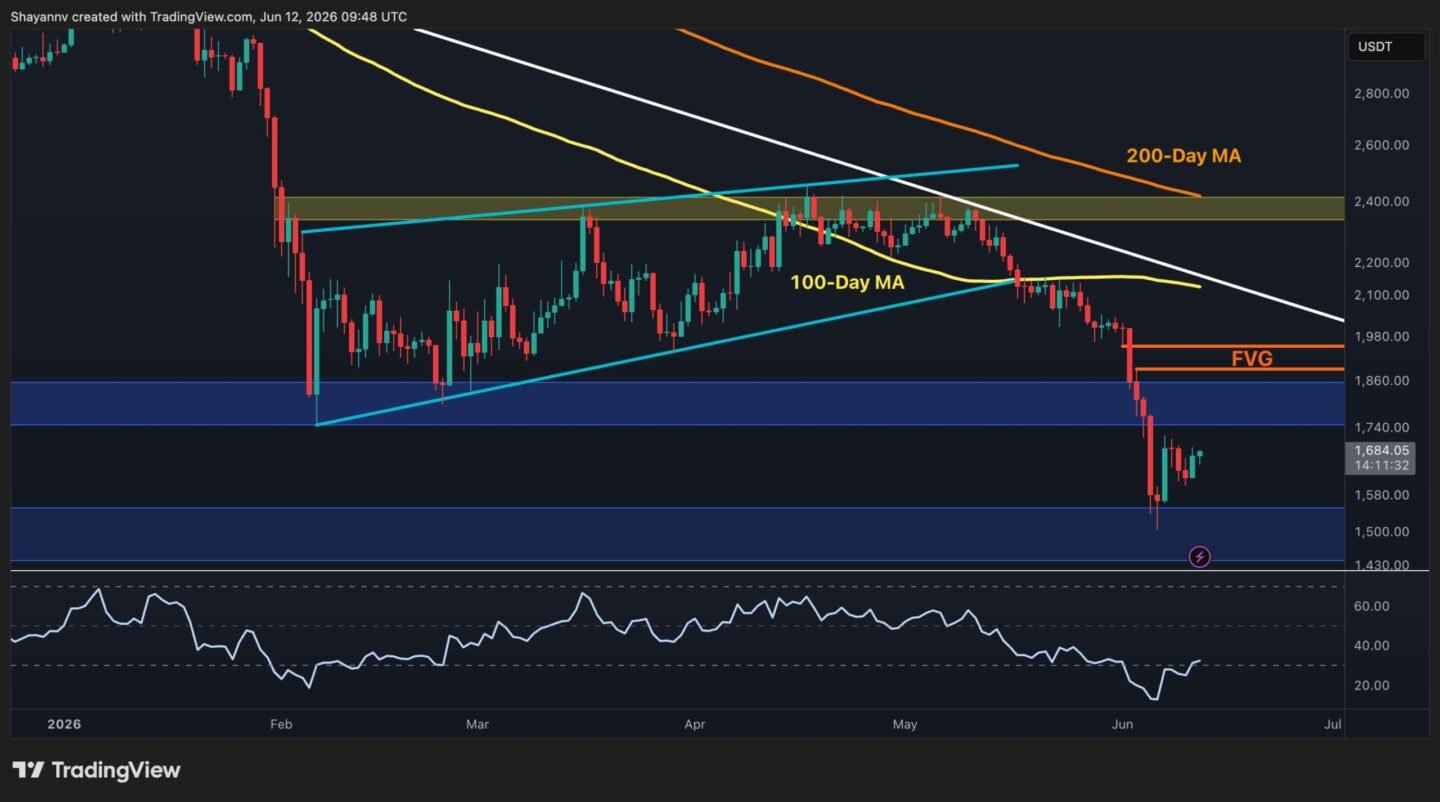
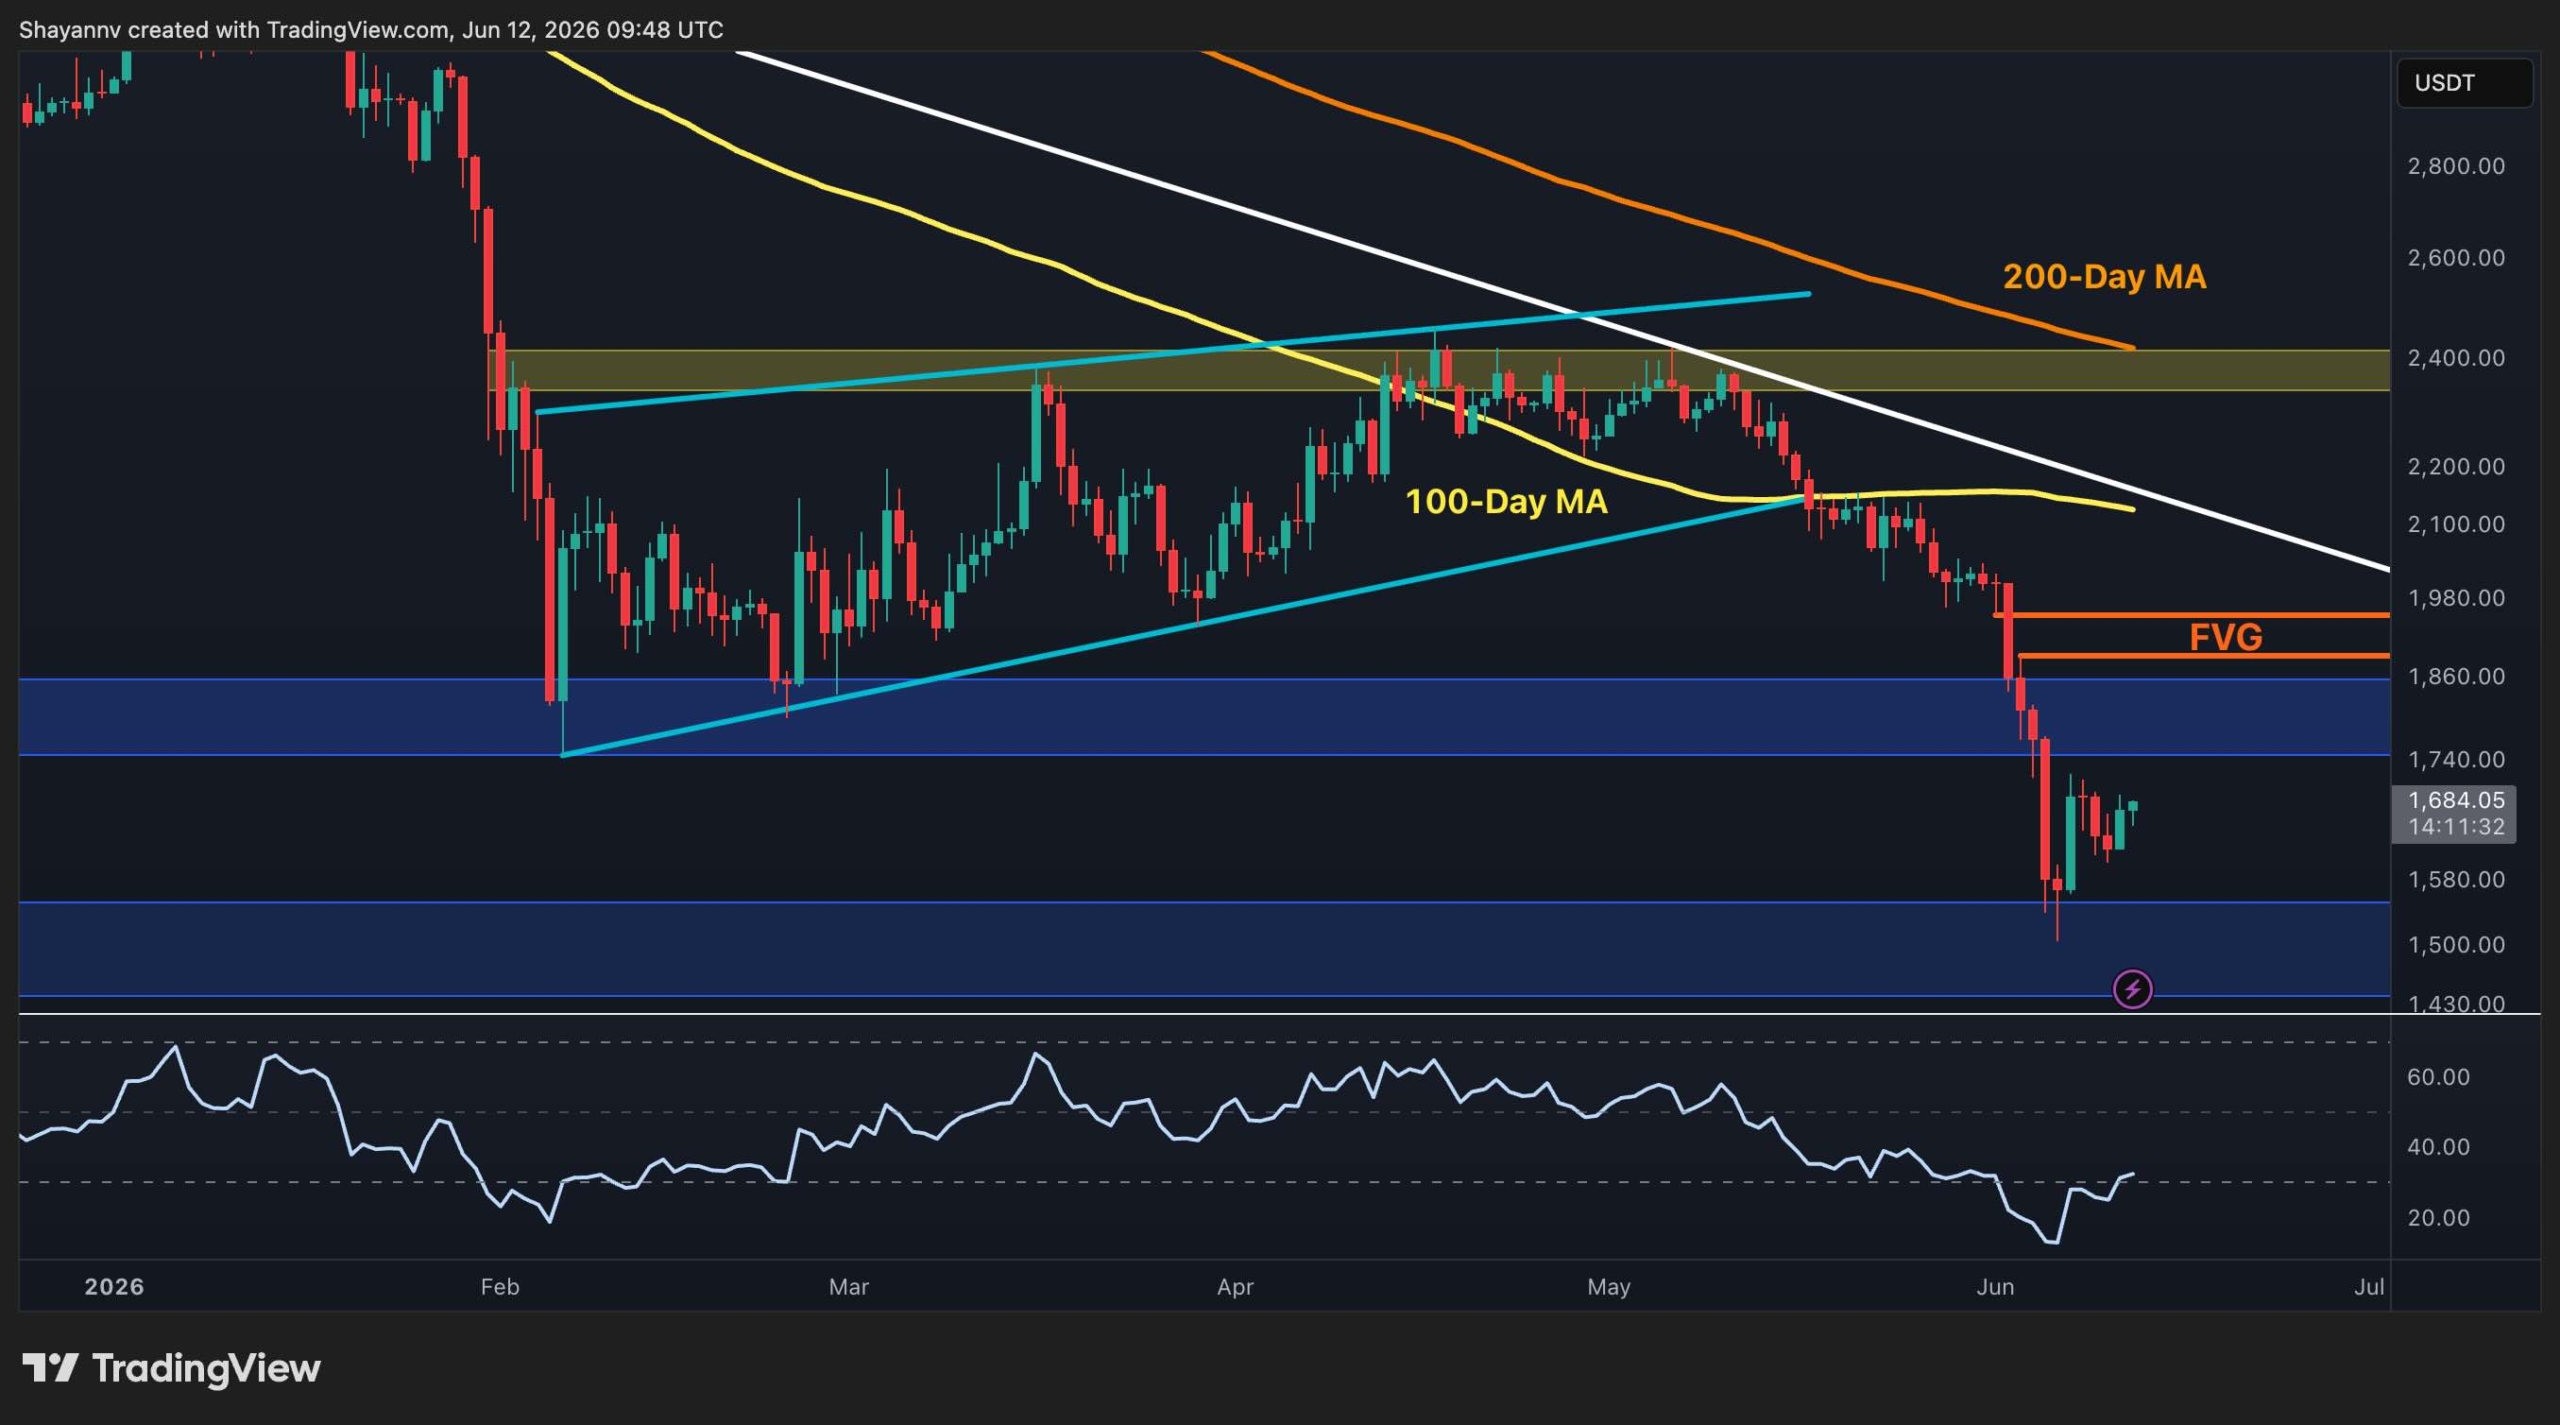
The daily chart shows a decisive breakdown from a multi-month bearish flag that had been developing since February. After repeatedly finding support along the rising lower trendline, ETH eventually lost the structure and accelerated lower in a clean, measured move.
The sell-off began when the price was rejected from the long-term descending trendline near the $2.4k level, which also pushed the asset below the 100-day moving average. The 100-day moving average, currently around $2.1K, has now flipped into resistance. Meanwhile, the 200-day moving average remains significantly higher near $2.4K. This indicates the overall strength of the broader downtrend.
Following the breakdown, ETH sliced through the major support zone at roughly $1.8K. This area previously acted as a strong demand region and is now likely to serve as resistance against any recovery attempt. A bearish Fair Value Gap (FVG) was also formed at approximately the $1.9k area, which creates another supply zone where sellers may re-enter the market in case of a retest.
The recent decline eventually found demand around the $1.5K support region, which triggered a relief bounce. However, despite recovering from the lows, ETH remains trapped beneath the former support area and has yet to invalidate the bearish breakdown.
As long as the price remains below the $1.8K-$1.9K resistance cluster, the broader outlook remains cautious. While the RSI has also rebounded from oversold conditions, it still remains below bullish territory. It indicates that momentum has improved but has not yet shifted decisively in favor of buyers.
ETH/USDT 4-Hour Chart
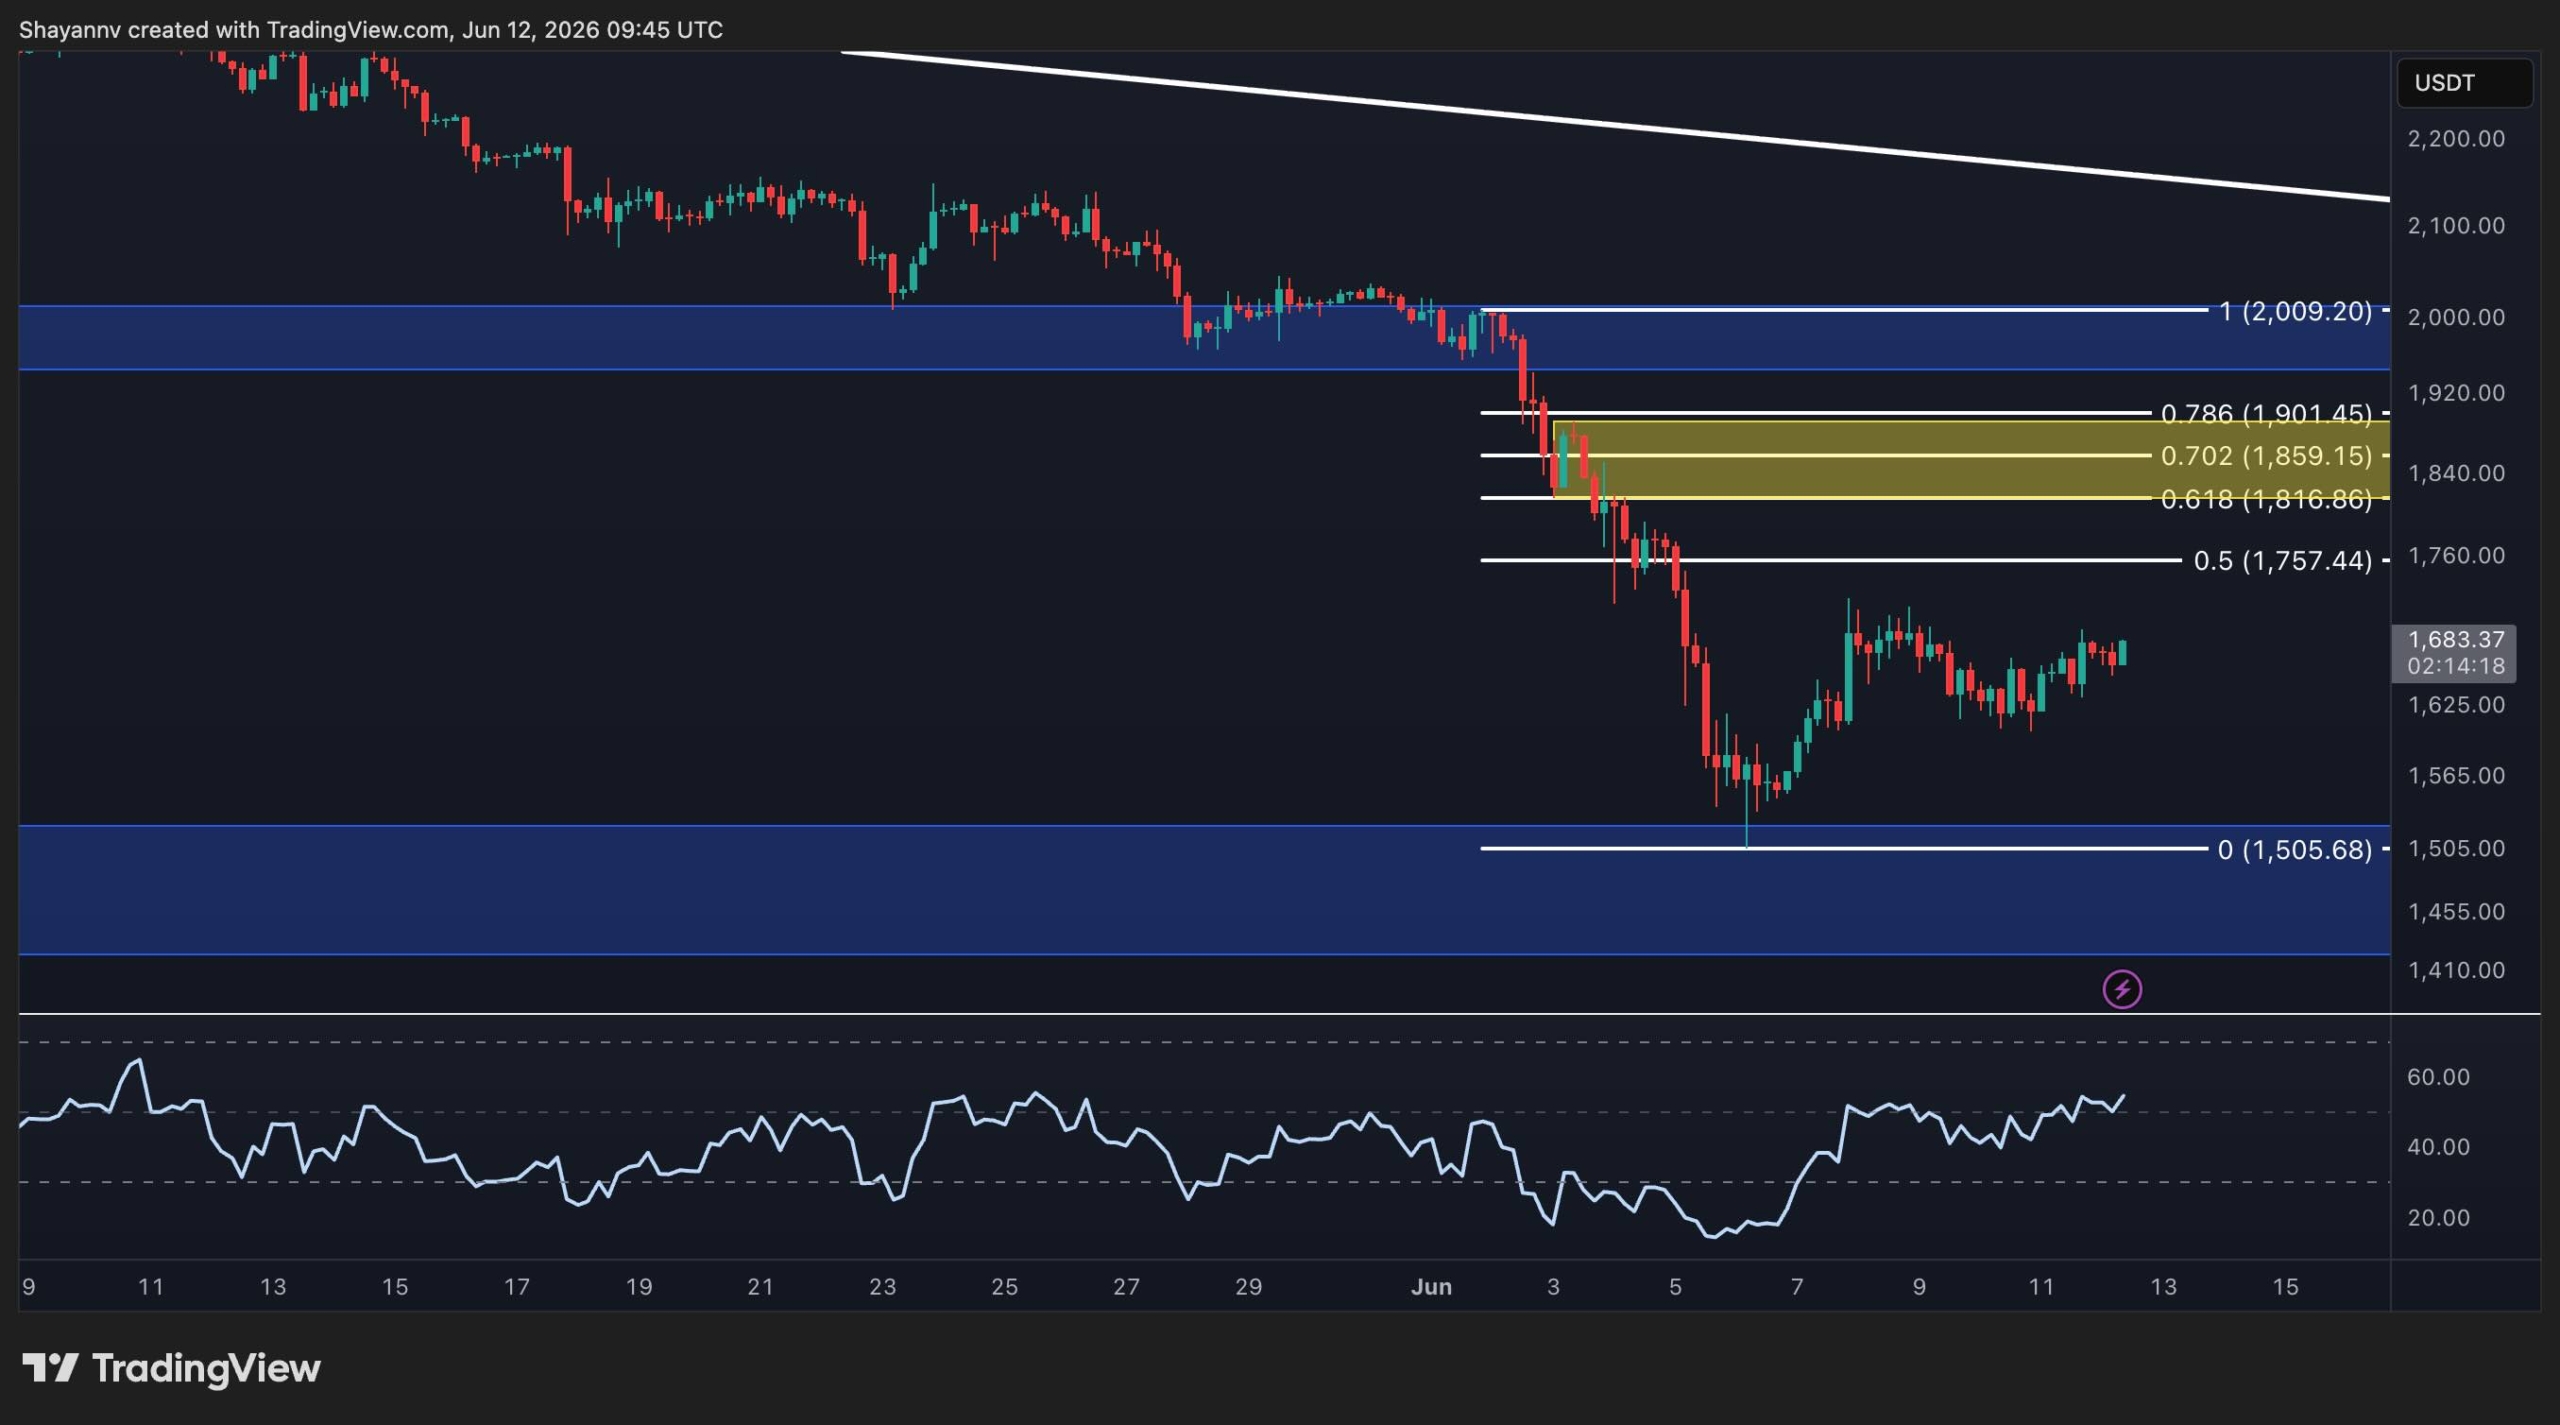
On the 4-hour timeframe, ETH experienced a sharp impulsive decline from the $2K region before finding support at the $1.5K demand zone. The bounce that followed appears corrective rather than impulsive, indicating that buyers have not yet regained control of the trend.
The market is currently trading around $1.68K while remaining below the 0.5 Fibonacci retracement level at approximately $1.76K. Above that, a dense resistance cluster exists between the 0.618 and 0.786 retracement levels, stretching from roughly $1.8K to $1.9K.
This Fibonacci zone aligns closely with a key bearish order block formed during the recent sell-off, making it a critical battleground. Any recovery into this range could attract renewed selling pressure from market participants looking to exit losing positions.
On the downside, the $1.5K support area remains the most important level. Losing this area would likely increase the probability of another leg lower and confirm that the recent rebound was merely a temporary pause within the broader downtrend.
Анализ настроения
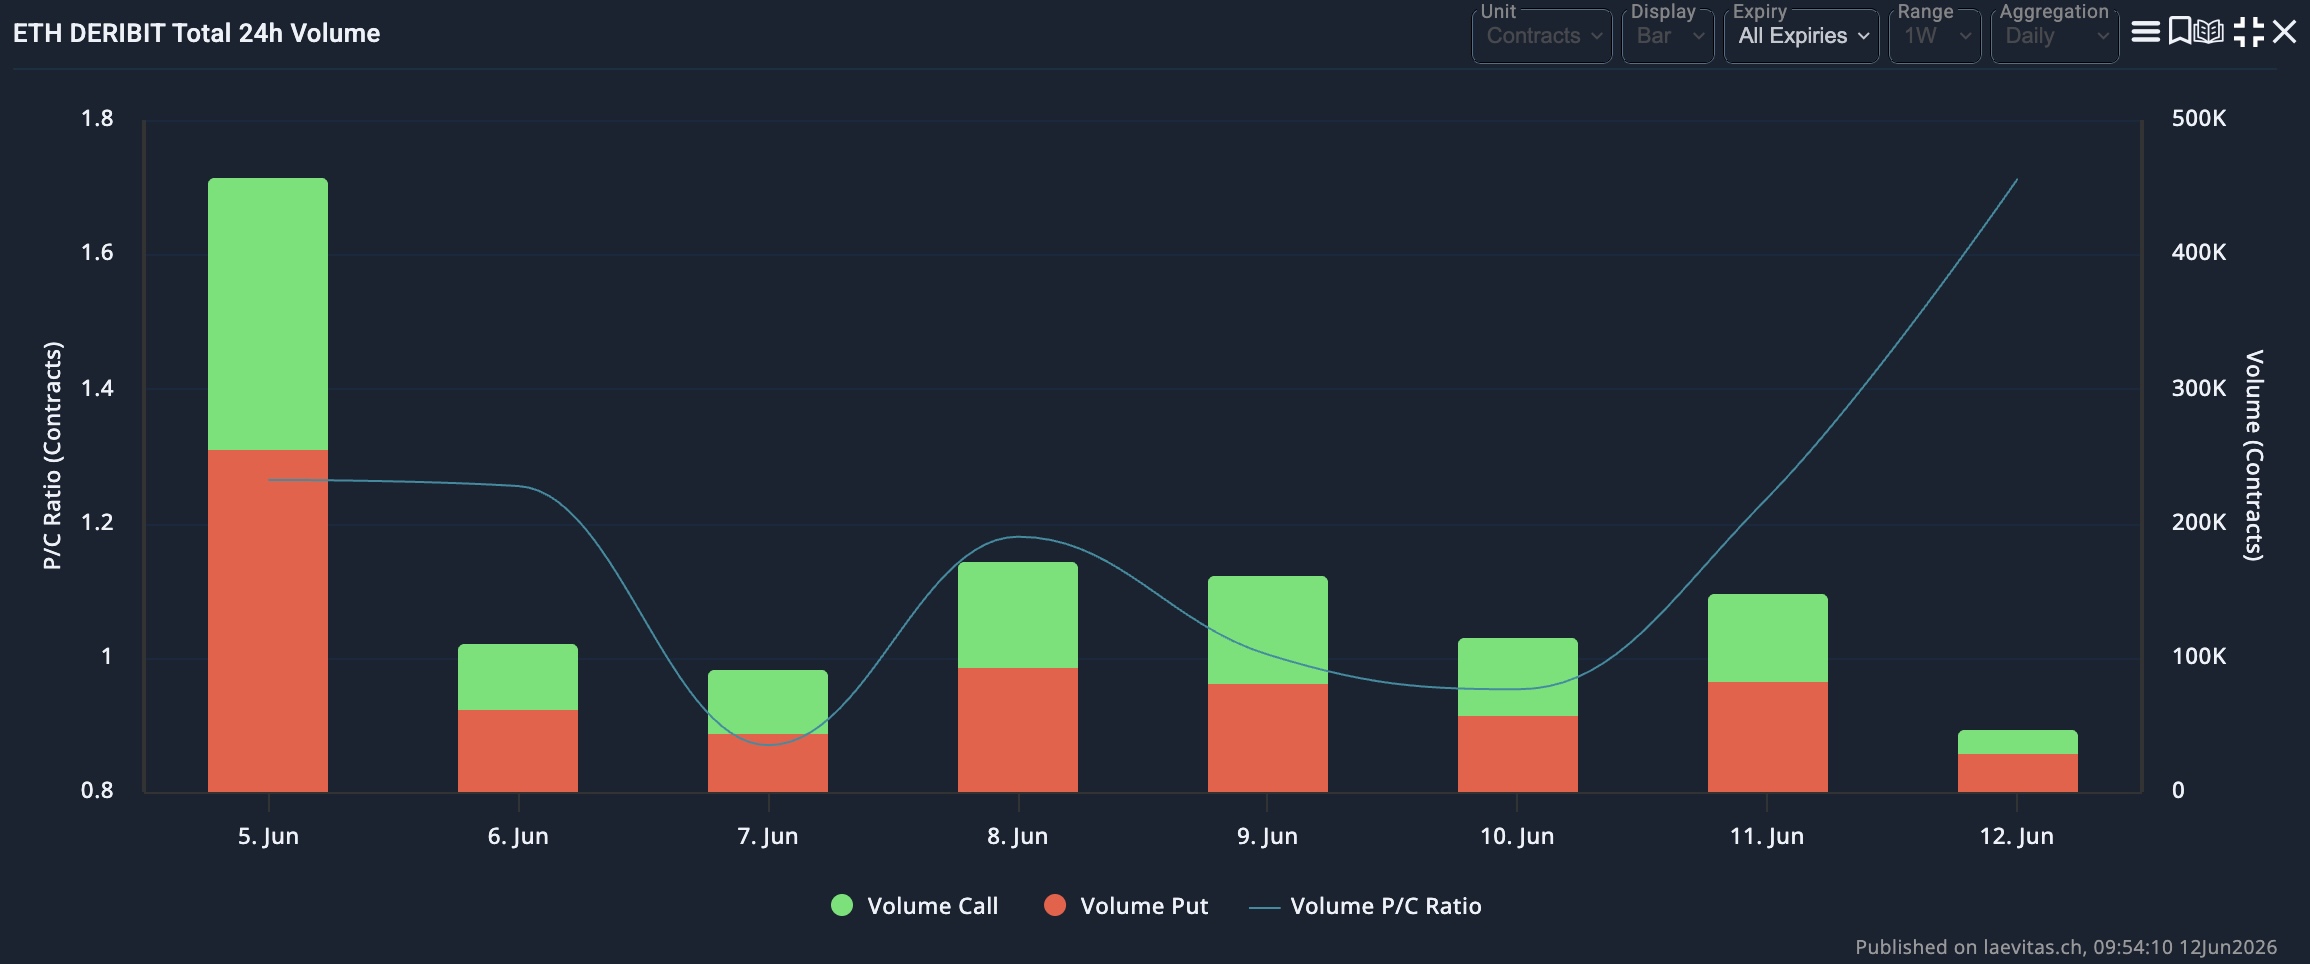
The derivatives chart highlights recent week’s ETH options activity on Deribit through the Put/Call volume ratio. Earlier in the week, the ratio declined below 1, which indicated that call volume was beginning to outpace put volume. This is a classic sign of improving trader sentiment.
More recently, however, the ratio has surged sharply toward 1.7 while overall daily volume remains relatively subdued. This suggests a significant increase in put activity relative to calls. Therefore, there is growing demand for downside protection despite ETH’s short-term rebound.
The divergence between recovering price action and rising put demand shows that options traders remain cautious about the sustainability of the current bounce. In other words, while spot buyers have stepped in around $1.5K, derivatives participants are still hedging against the possibility of another downside move.
For sentiment to improve meaningfully, ETH would likely need to reclaim the $1.8K-$2K resistance region while the put/call ratio begins trending lower again. Until then, the options market suggests that traders remain defensive despite the recent recovery attempt.
Пост Ethereum Price Analysis: ETH’s Next Rally Attempt Hinges on This Key Level появились сначала на CryptoPotato.


Добавить комментарий