Ethereum remains in a range phase following the recent market rebound, but continues to hold above key institutional demand zones. The market has entered a period of consolidation between structural supports and resistances, suggesting that the next decisive move will likely be driven by liquidity displacement from this range.
Technical Analysis
By Shayan
The Daily Chart
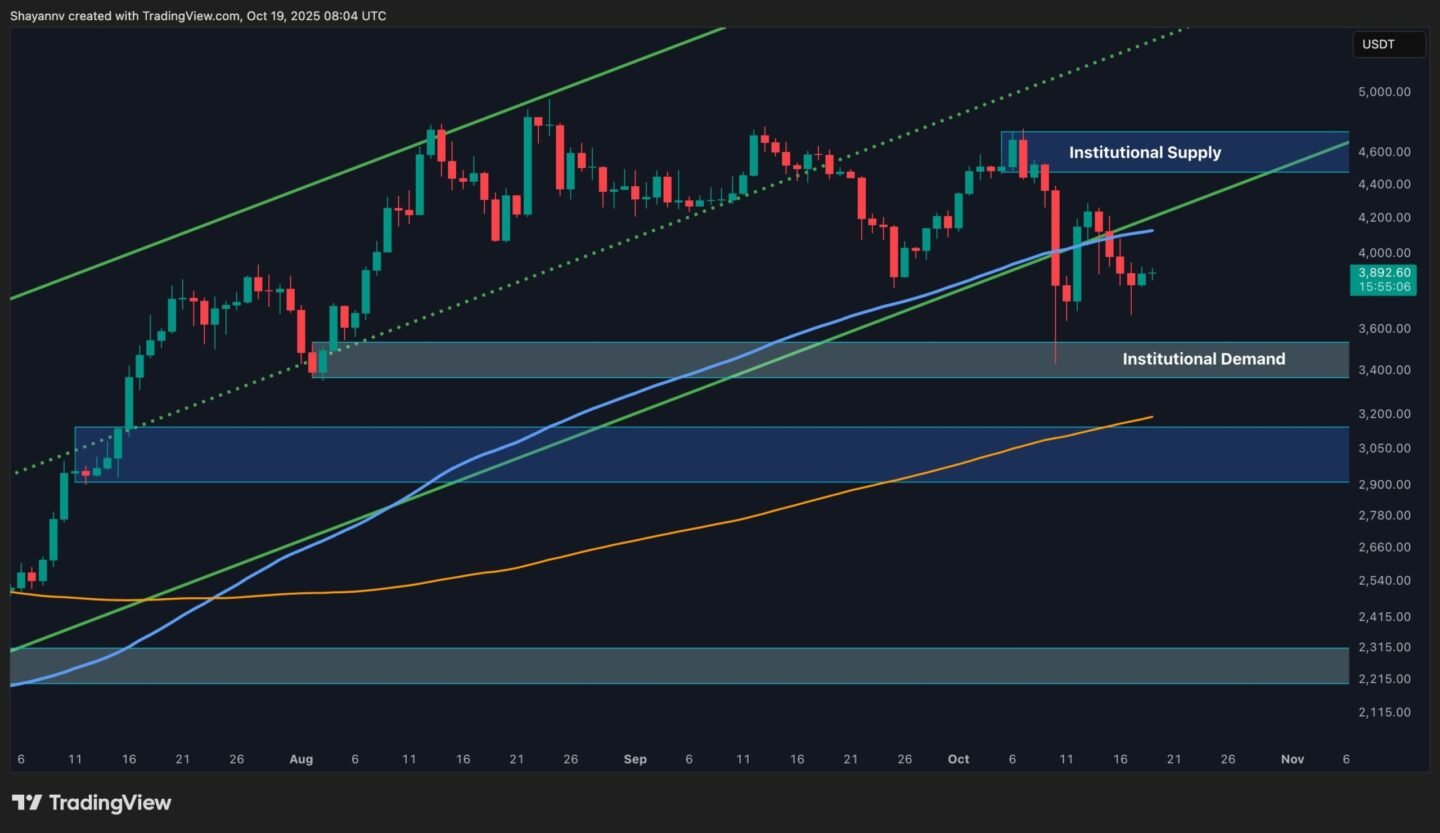
On the daily timeframe, Ethereum continues to trade between two major zones: the institutional supply area around $4.6K–$4.7K and the institutional demand zone near $3.4K–$3.5K. After losing the channel’s lower trendline support earlier this month, the asset has now retested it from below, confirming it as resistance.
The structure suggests that Ethereum is currently in a mid-range equilibrium phase, where neither buyers nor sellers have clear control. The 100-day MA, which previously provided dynamic support, has now flipped into a resistance zone near $4.1K–$4.2K, while the 200-day MA near $3.1K remains the last line of structural defence.
As long as the price remains above the $3.4K institutional demand, Ethereum’s macro trend stays intact. However, failure to maintain this level could expose the market to a deeper retracement toward the $3.0K–$2.9K liquidity cluster, where the 200-day MA and prior accumulation base converge.

The 4-Hour Chart
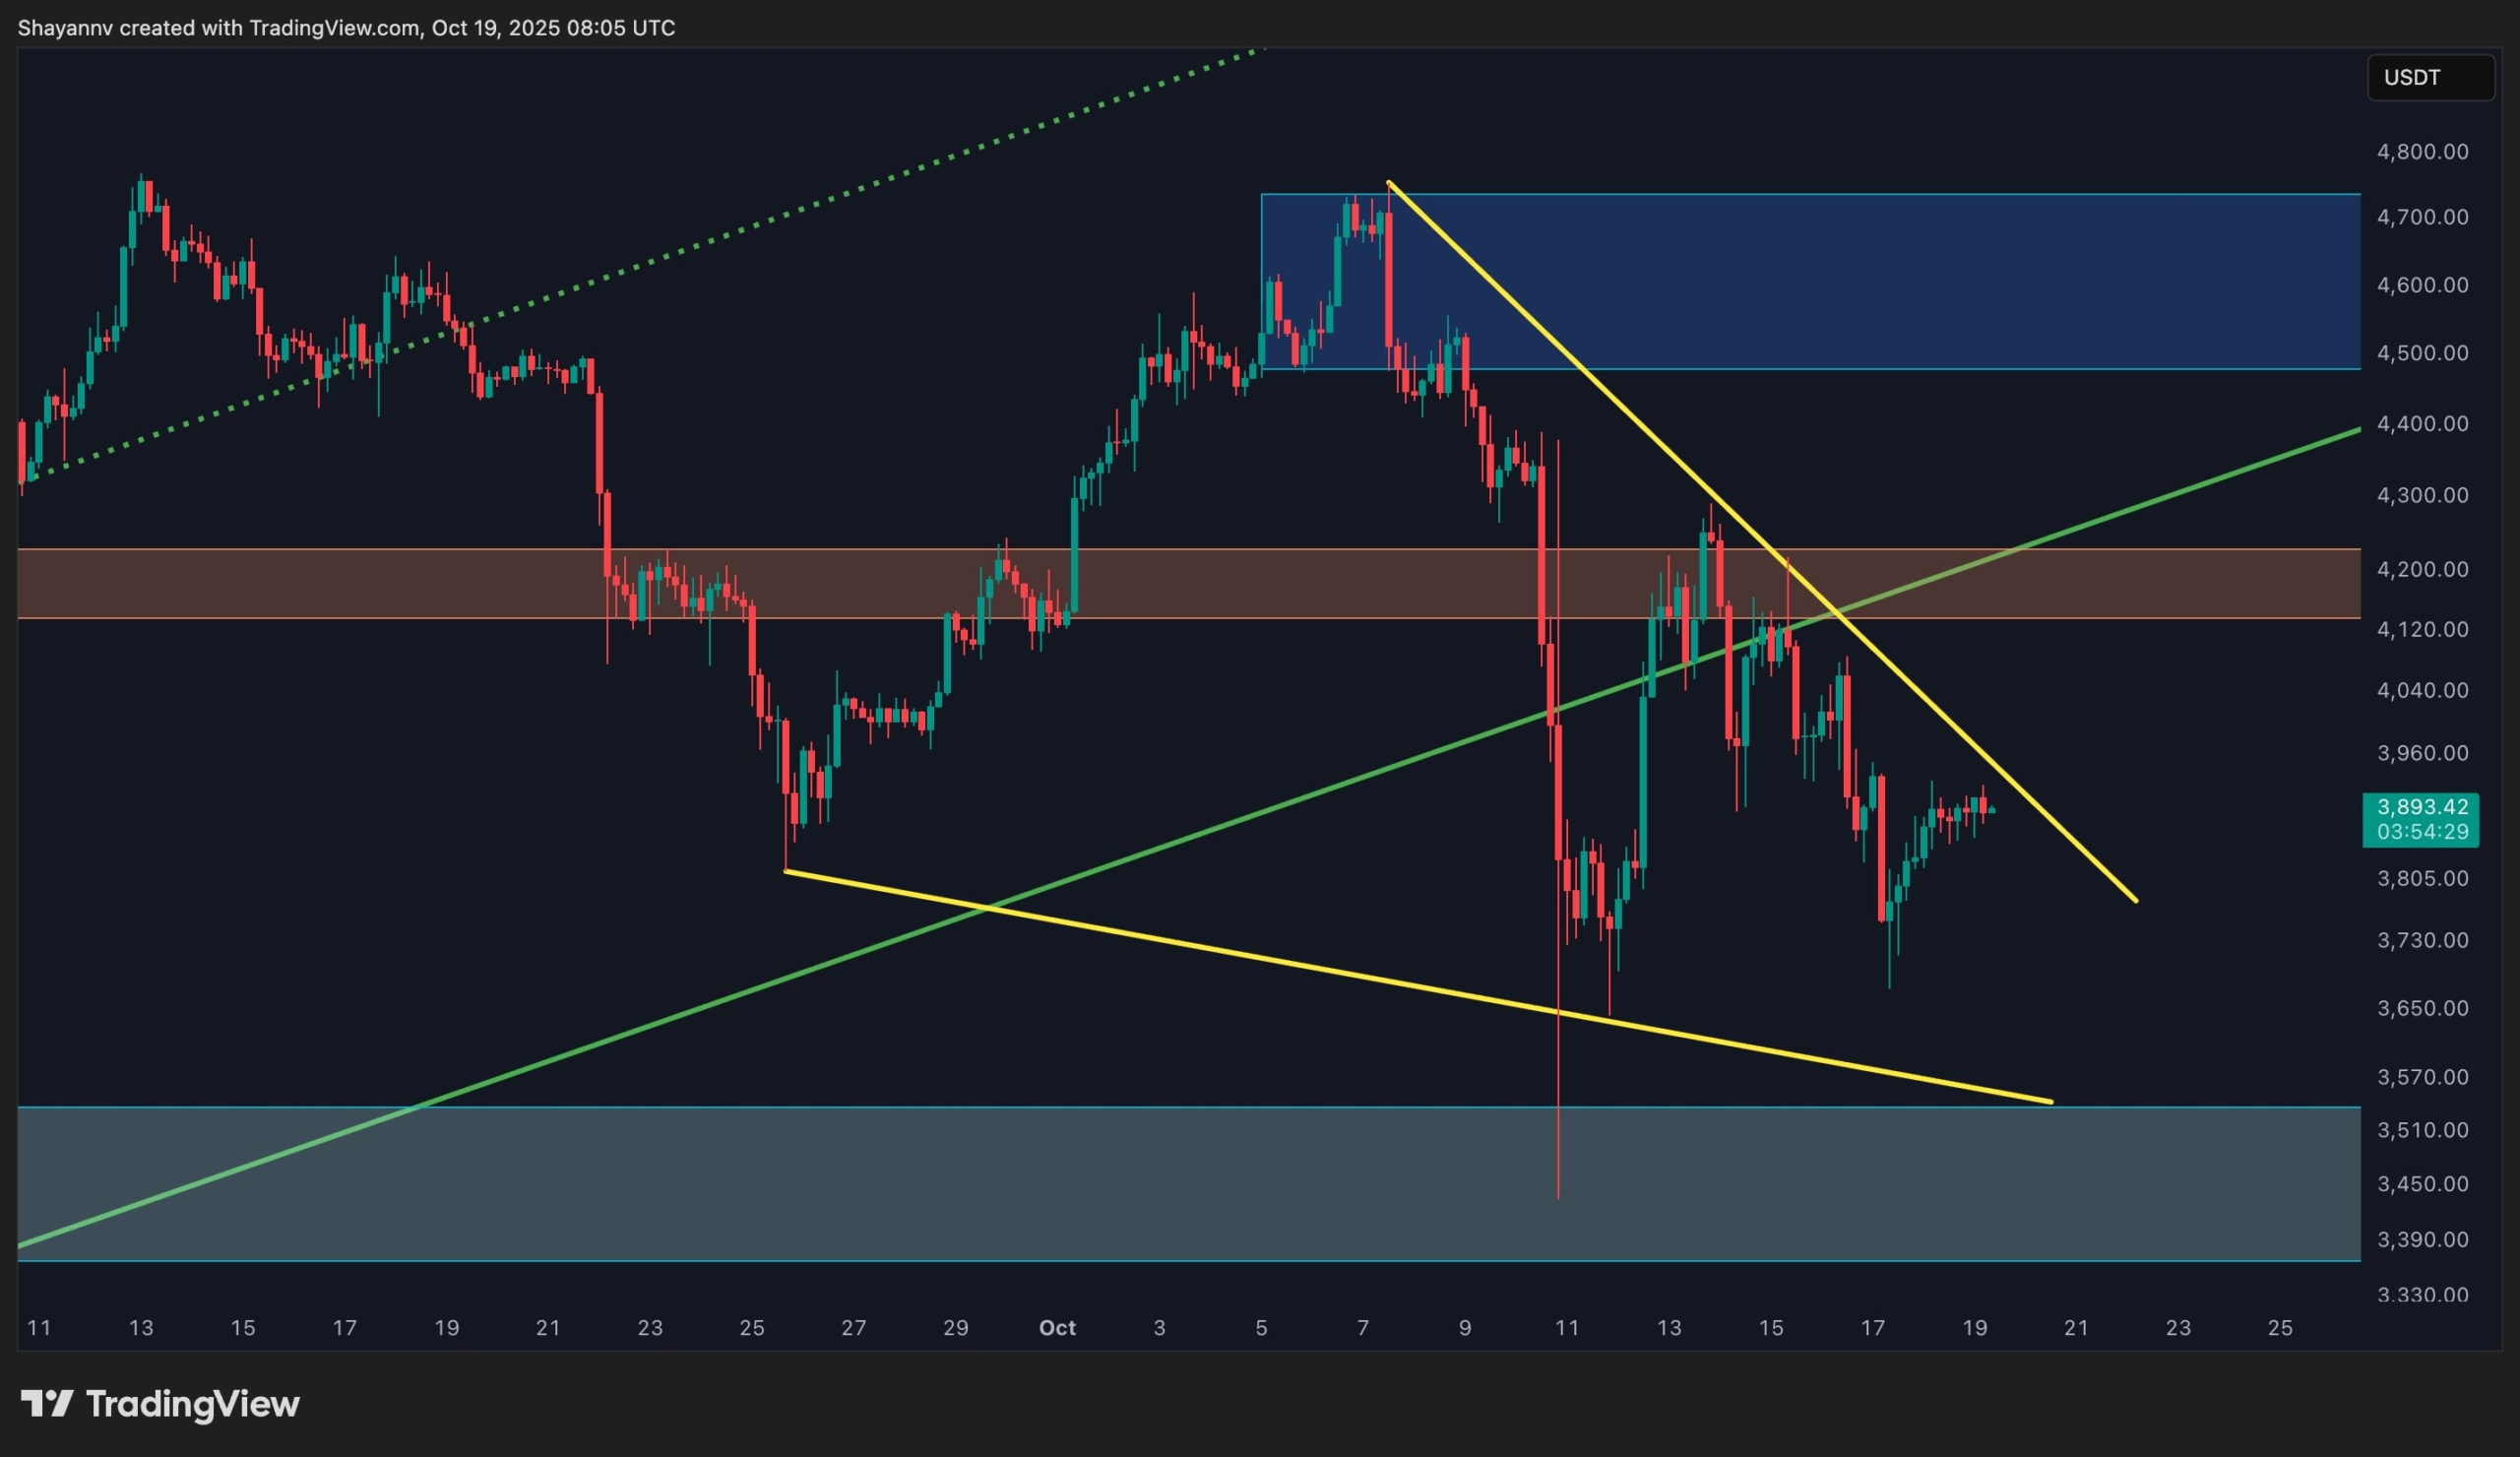
The 4-hour structure reveals a descending wedge pattern, forming after a sharp rejection from the $4.2K breakdown zone. The repeated rejections at this confluence of descending and ascending trendlines reflect the ongoing tug-of-war between short-term buyers and sellers.
At the same time, the lower boundary of the wedge aligns closely with the broader institutional demand zone, suggesting that Ethereum is approaching a point of compression where volatility expansion is imminent.
If the price breaks above the descending trendline and closes above the $4K–$4.1K resistance, it could confirm a reversal, targeting $4.4K–$4.6K. Conversely, a breakdown below $3.7K would likely trigger a deeper decline toward $3.4K, the same zone that underpins the broader bullish structure. Until confirmation occurs, Ethereum remains range-bound, oscillating between structural supply and demand.
Sentiment Analysis
By Shayan
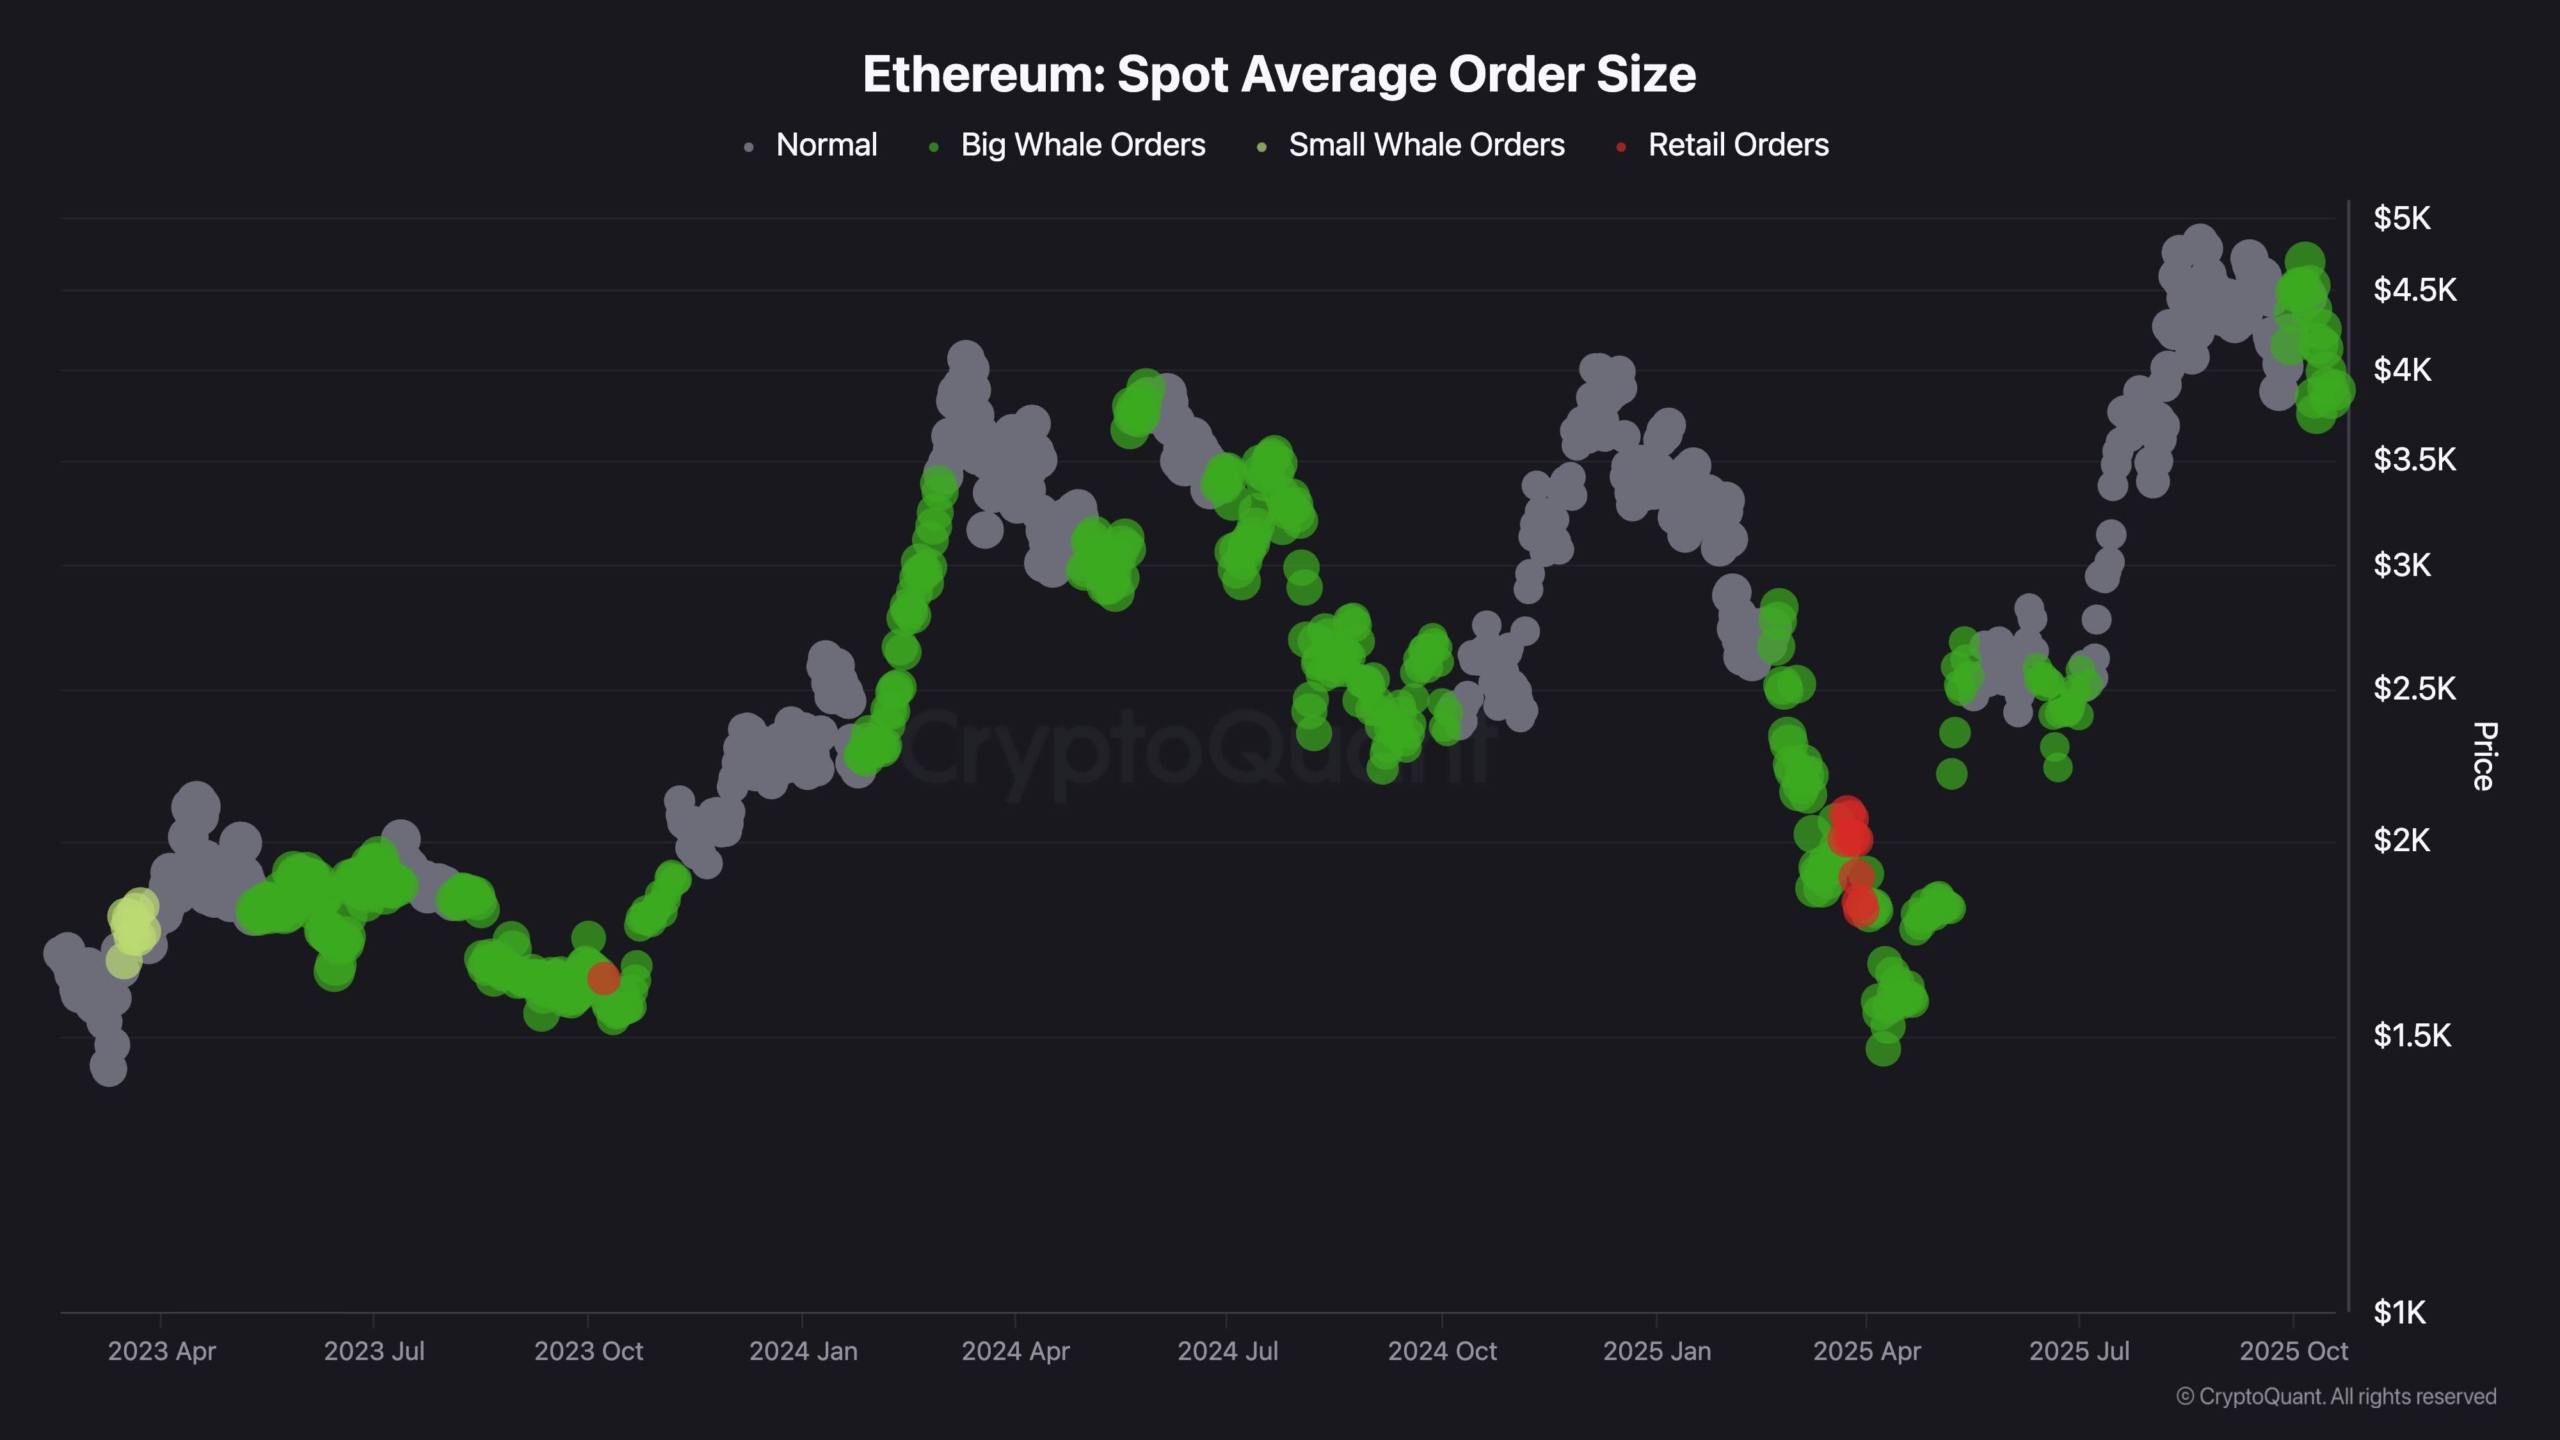
Recent on-chain data points to a renewed tightening in Ethereum’s market structure. Since mid-October, two significant dynamics have emerged simultaneously: exchange reserves have declined sharply, while average spot order sizes have increasingly been dominated by large whale transactions.
Following October 15, ETH’s price has remained relatively stable just below the $4K level, but the underlying market composition has shifted meaningfully. Whale-sized spot orders (green clusters) have expanded, signalling renewed activity from deep-pocketed participants, while the amount of Ethereum held on exchanges, measured in USD terms, has dropped to one of the lowest levels of 2025.
This combination, shrinking exchange reserves and growing whale spot activity, has historically indicated strategic accumulation by institutional or high-net-worth investors. With liquidity thinning across exchanges, even moderate inflows of new demand could produce amplified price reactions, as reduced sell-side availability magnifies volatility to the upside.
Ethereum now appears to be entering another supply squeeze phase, echoing the quiet but powerful accumulation period of late 2020. During that cycle, consistent spot buying and exchange outflows preceded one of ETH’s strongest multi-month rallies. If macro conditions stabilise and ETF-related inflows return, the current structural tightening could serve as the foundation for Ethereum’s next major upward cycle.
A publicação Ethereum Price Analysis: Bullish Setup at Risk if ETH Falls Below This Key Level apareceu primeiro em CryptoPotato.


Deixe um comentário