
Bitcoin’s weekly chart is showing an uncomfortable comparison to one of the most brutal sell-offs in its history, and at least one analyst believes the worst may still be ahead.
This technical outlook is looking at the current price action as a mirror of the 2022 macro fractal sequence that sent Bitcoin from $69,000 to a cycle low near $15,500, implying that the current cycle could see a similar drop.
A 2022 Repeat? The Fractal That Raises Concerns
Crypto analyst philarekt posted a warning on X this week, identifying what he described as “the most dangerous macro fractal” currently playing out in Bitcoin’s price structure. The technical case rests on a side-by-side comparison of two weekly Bitcoin charts: the 2021 to 2023 cycle on the left and the current cycle on the right.
In the 2021 chart, Bitcoin reached a peak price above $69,000 and proceeded to form a 3-tap structure, which are three distinct lower highs arranged within a descending channel, each bounce rejected before a final capitulation leg lower. The price ultimately fell 34% from the final tap to the absolute cycle bottom in a move that caught many market participants off-guard.
The current chart, with a cycle peak at $126,000 in October 2025, shows the same architecture forming in almost identical proportion. Both the 2022 and 2026 panels show Bitcoin respecting a slanted resistance line at the top while gradually falling within a downward channel. Each bounce fails to break out, and eventually the price has created successive lower lows.
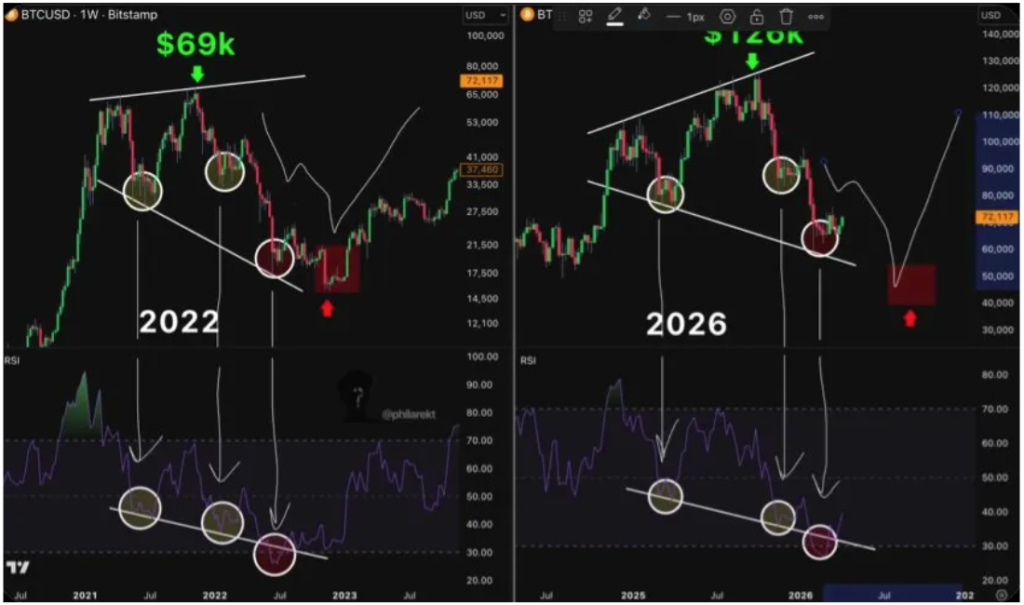
Bitcoin Price Chart. Source: @philarekt On X
What Happens If The Fractal Completes?
The weekly RSI, which tracks momentum, is following the same pattern observed in 2022. Lastly, there’s a moving average death cross on the Bitcoin price chart, where the short-term average has crossed below a long-term average.

This death cross appeared in early March when the 50 Simple Moving Average (SMA) crossed below the 200 Simple Moving Average (SMA). An equivalent 50/200 SMA death cross appeared in 2022 after Bitcoin was already down 58% from its high, and the cryptocurrency then declined a further 46% before finding a bottom.
If the sequence continues to play out as outlined, Bitcoin could be heading to a final capitulation move into the range between $40,000 and $50,000. At the time of writing, Bitcoin is trading at $72,756, up by 1.7% in the past 24 hours. The projected decline is taken directly from the 2022 template: a 34% decline from the current price zone would place the Bitcoin price within that range.
However, the outlook is not entirely bearish after that scenario. The same fractal that points to a breakdown also points to what comes next. The capitulation in 2022 led the transition into accumulation that built the foundation for the next bull cycle.
Wyróżniony obraz z Pexels, wykres z TradingView


Dodaj komentarz