
XRP is trading at a pivotal level as the broader crypto market regains strength and bullish sentiment returns. While macro uncertainty and volatility persist, XRP has remained resilient, holding firmly above key demand zones. The asset is now attempting to reclaim higher supply levels, with bulls pushing for a breakout that could define its next major move.
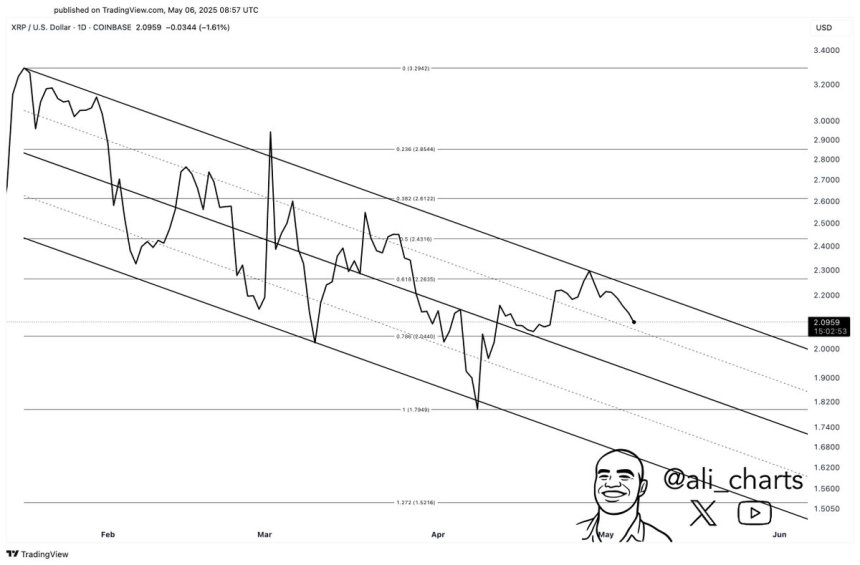
Top analyst Ali Martinez recently shared a technical view showing that XRP is currently trading within a very tight range. This period of consolidation has compressed volatility, setting the stage for a potential explosive move. According to Martinez, a decisive daily close outside this range could determine the direction of the next major trend—either a breakout toward previous highs or a drop toward lower support levels.
For now, XRP appears to be leaning bullish as it tracks the momentum seen across other major cryptocurrencies. Traders are watching closely to see if XRP can reclaim the $0.70–$0.75 range, which could open the door to a broader rally. Until then, the current structure suggests that XRP is coiling for a breakout, and the next few sessions could be decisive in confirming the trend ahead.
XRP Trades Above $2 As Market Awaits Breakout Or Breakdown
XRP is trading above the $2 mark, holding strong amid rising volatility and uncertainty across the crypto market. While bulls are showing signs of strength, they continue to struggle with the $2.35 resistance level—a barrier that has capped recent upward momentum. At the same time, bears have been unable to push the price below current support levels, keeping XRP locked in a tight consolidation range.
The broader market is heating up, with Bitcoin testing key resistance near all-time highs, creating an environment where altcoins like XRP could soon follow with significant moves. Analysts are closely watching this setup, with many calling for a bullish expansion phase if XRP can break through overhead resistance and confirm strength.
Martinez has identified two critical levels that will likely define XRP’s short-term trend: $2 and $2.26. According to Martinez, a decisive daily close outside this range could set the tone for the next major trend move—either a breakout toward new highs or a breakdown into deeper consolidation.
However, market risks remain. Ongoing geopolitical tensions between the US and China continue to influence risk sentiment, and traders remain cautious as these macro factors develop. Still, XRP’s price structure shows strength, and if bulls can overcome $2.35, the asset could gain serious momentum.
For now, all eyes are on XRP as it coils near key levels. The next few days will be crucial in determining whether this consolidation resolves to the upside or signals another round of range-bound price action. Either way, a major move appears to be on the horizon.
Price Analysis: Technical Details
XRP is currently trading at $2.14 after bouncing off recent lows near the $2.05 level. The 4-hour chart shows the price holding just above the 200-period simple moving average (SMA) at $2.11 and slightly below the 200-period exponential moving average (EMA) at $2.17. This positioning highlights a key zone of indecision, with bulls and bears locked in a tug-of-war around a major support and resistance confluence.
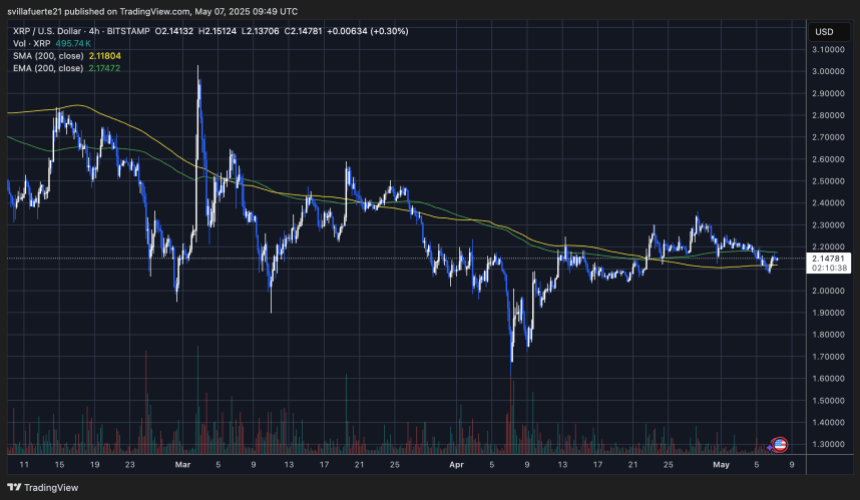
The price structure remains neutral but constructive. After a failed attempt to push above the $2.30–$2.35 resistance range in late April, XRP has entered a phase of consolidation. Despite the pullback, bulls have defended the $2 psychological level multiple times, indicating strong demand in that area.
Volume has remained steady, and XRP appears to be forming a higher low, which could serve as a launchpad for another attempt at the range highs. A breakout above the $2.26–$2.35 zone would likely confirm bullish continuation and open the path toward $2.50 and beyond.
However, a breakdown below $2.05 could invalidate the current setup and expose XRP to further downside. For now, XRP remains at a pivotal level, and the next 48 hours will be critical in determining its short-term direction.
Featured image from Dall-E, chart from TradingView


Parašykite komentarą