
An analyst on X has made a bold call on Ethereum, stating that the asset is on the verge of a parabolic move. The claim is based on a golden triangle formation on the chart, a setup that shows a breakout could be approaching for the leading altcoin. This approaching breakout could also serve as the driving force for a broader altcoin market rally.
Golden Triangle Pattern 9 Years In The Making
Technical analysis of Ethereum’s 3-week chart stretching back to 2017 shows the cryptocurrency trading within a narrowing triangular structure. The pattern is defined by a rising lower trendline anchored from the March 2020 Covid crash low and a horizontal upper trendline connecting the rally peaks of 2021, 2024, and 2025.
Over nearly a decade of price action, ETH has repeatedly respected both boundaries, with bounces within the narrowing range. This has led to the formation of a golden triangle, which is a macro structure with a better possibility of resolving to the upside.
As it stands, the ETH price is trading at the lower end of this formation in what looks like a higher low compared to the lowest price in 2025. The projected move shows a bounce from this level that eventually pushes Ethereum to break above resistance and transition into an upward parabolic move.
The projected breakout path on the chart shows ETH exiting the apex of this triangle to the upside, with a parabolic rally that climbs above $12,000 and beyond by 2027 to 2028. This move is expected to spill into other cryptocurrencies with a huge rotation that supports an altcoin season.
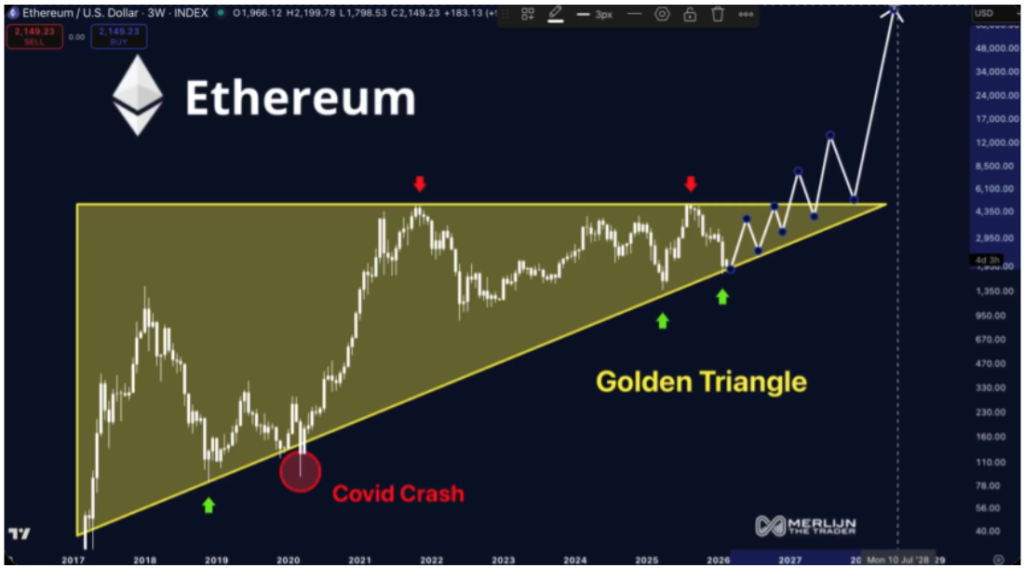
Ethereum’s Golden Triangle. Source: @zenkaixbt On X
$2,800 As The Next Stop
While the Golden Triangle analysis looked at the macro context, analyst Crypto Feras has identified a more immediate target that could cement the first significant milestone of any sustained recovery.
Svetainė analysis is based on the 3-day candlestick chart, and it is centered on the idea that Ethereum’s current structure is more important than short-term headlines. As noted by the analyst, Ethereum has maintained a consistent 3D pattern on higher time frames since February, even as markets reacted to external shocks, most especially the geopolitical tensions in the Middle East.

This consistency has led to the same creation of a higher low compared to the 2025 bottom that respects a rising support line. This rising diagonal support line, visible in the chart below, connects the lows of 2022, 2023, and 2025, and each of those cycle bottoms preceded substantial rallies.
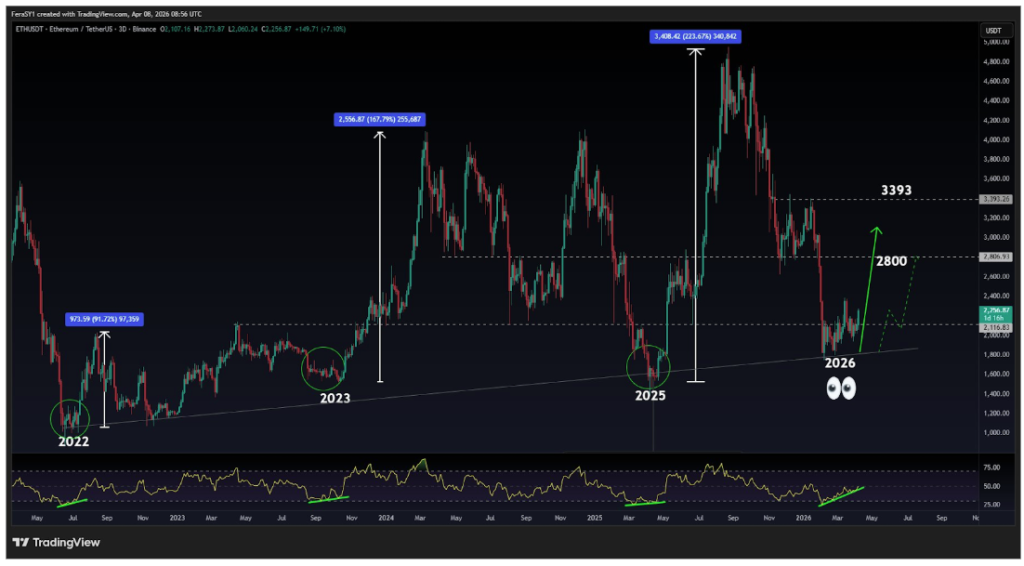
Ethereum Price Chart. Source: @CryptoFeras On X
The 2022 low produced a 91.72% recovery, the 2023 low was followed by a 167.79% rally, and the 2025 low was followed by a 223% rally.
The current 2026 low, printed in February around $1,800, appears to be setting up along the same structural sequence, with the projected path on the chart showing ETH targeting $2,800 as the first recovery level and then an extension to $3,393.
Featured image from Unsplash, chart from TradingView


Parašykite komentarą