Ethereum is now trading at a pivotal juncture after days of consistent selling pressure that have pushed the price down by more than 12% since last Tuesday. Currently hovering around the $2,400 mark, ETH is struggling to maintain bullish momentum, and many analysts warn that a deeper correction could follow if bulls fail to defend this crucial support zone. The recent drop reflects broader market uncertainty, with rising volatility shaking investor confidence just as ETH appeared ready to join a wider altcoin breakout.
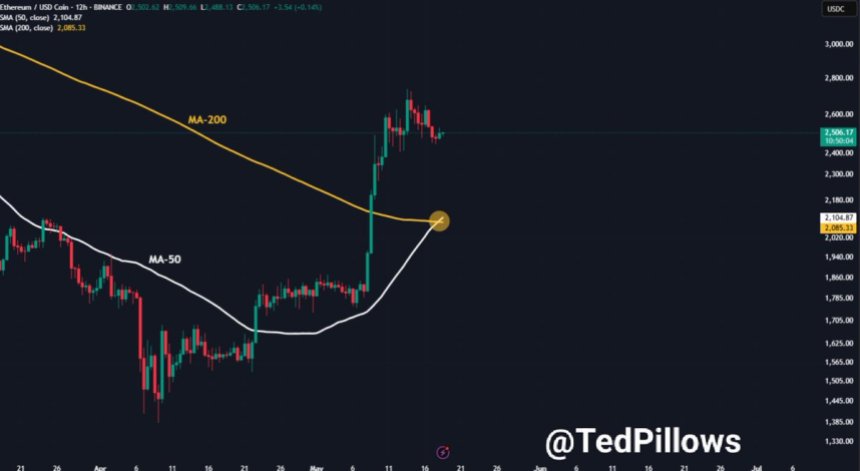
Despite this weakness, there’s growing optimism in some corners of the market. Top analyst Ted Pillows shared a technical analysis showing that a Golden Cross has been confirmed on Ethereum’s 12-hour chart — a signal traditionally viewed as a precursor to major bullish moves. This crossover, which occurs when the 50-period moving average crosses above the 200-period moving average, often marks the beginning of an extended uptrend.
If bulls manage to hold current levels and reclaim higher resistance near $2,600, the Golden Cross could become a turning point. Until then, the coming days will be critical in determining whether Ethereum can bounce or sink into a longer consolidation phase.
Volatility Hits Ethereum Amid Golden Cross Signal
Ethereum saw sharp volatility over the weekend, surging past $2,550 before rapidly reversing and falling back into the $2,400 zone within hours. This sudden move has sparked renewed uncertainty, as analysts grow cautious about the fading bullish momentum and rising selling pressure. While ETH remains one of the stronger performers in the broader altcoin market, it is still down 36% from its December high of around $4,100. This leaves bulls with a clear challenge: hold current levels and regain control by pushing prices above $2,800 to ignite a sustained rally.
The $2,400 level is now acting as a critical support zone. A break below it could trigger a deeper retracement, likely dragging Ethereum into a consolidation range or even toward lower support levels. Still, technical signals offer a glimmer of hope.
According to Pillows, Ethereum recently confirmed a Golden Cross on the 12-hour chart — a bullish pattern that occurs when the 50-period moving average crosses above the 200-period moving average. Historically, such signals have preceded strong upside moves, and Pillow believes this one could pave the way for Ethereum to reach $3,000 in the near term.

However, for that to happen, buyers must step in decisively. Volume has tapered off, and sentiment appears fragile after last week’s breakdown. If bulls can defend the $2,400 region and reclaim higher resistance quickly, the Golden Cross might mark the beginning of Ethereum’s next leg up. Until then, the market remains in a wait-and-see mode, watching whether the bullish signal can outweigh the growing pressure from sellers.
ETH Tests Key Support After Drop From Local Highs
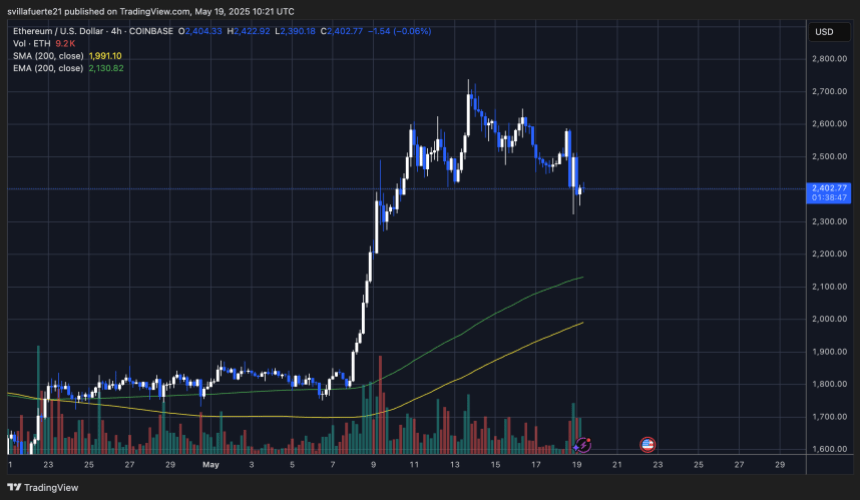
Ethereum is trading at $2,402 after a sharp Sunday sell-off, where the price spiked to $2,670 before retracing more than 10% in less than 24 hours. As seen in the 4-hour chart, ETH is now consolidating right above the $2,390–$2,400 zone, a level that is proving critical for bulls to hold. This area coincides with a prior consolidation zone and could act as a short-term support base.

The 200-period EMA on the 4H chart is currently at $2,130, and the 200 SMA is near $1,991 — both are significantly below the current price and offer long-term trend support. However, the volume profile shows a spike in sell-side activity during the pullback, suggesting that short-term traders are locking in profits. If price breaks below $2,390, a deeper retrace toward the $2,200–$2,300 range becomes likely.
On the upside, ETH must reclaim $2,550 to reestablish momentum. Failure to do so could confirm a local top. The price action is clearly indecisive, and this range-bound structure could persist unless bulls reassert strength with a decisive move above $2,600. Until then, the $2,400 level remains a battleground between buyers and sellers amid elevated volatility.
Featured image from Dall-E, chart from TradingView


답글 남기기