
Ethereum reached multi-year highs, breaking decisively above the $4,300 level after several days of strong bullish momentum. This breakout marks Ethereum’s highest level since late 2021, fueled by growing institutional demand, ETF inflows, and expanding on-chain activity. However, fresh market data from CryptoQuant suggests that caution may be warranted in the short term.
The all-exchange Estimated Leverage Ratio (ELR) has climbed to 0.68, approaching historical highs and signaling excessive market-wide leverage. While Binance’s ELR sits lower at 0.52, indicating more measured positioning on the world’s largest exchange, higher relative leverage on other platforms points to elevated speculative activity elsewhere.
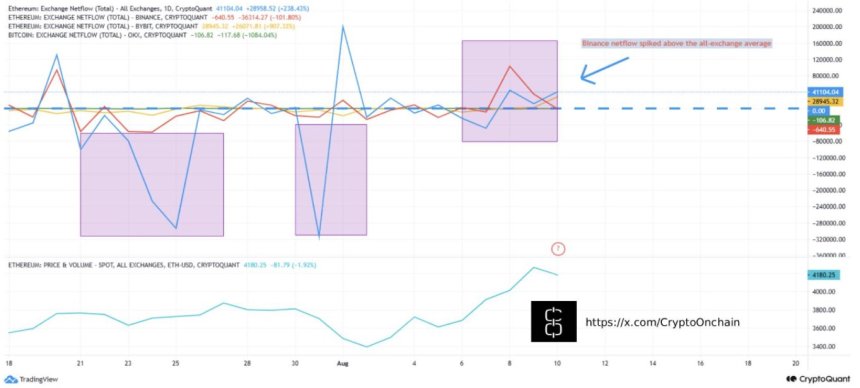
Ethereum’s price is currently testing a critical resistance zone between $4,020 and $4,060—a historically pivotal area that has often determined whether a rally accelerates or faces a sharp pullback. Adding to the short-term risk profile, Binance netflows have spiked significantly above the all-exchange average, suggesting concentrated inflows that may lead to localized sell pressure, possibly linked to liquidations or arbitrage-driven trades.
Ethereum Mid-Term Outlook: Institutional Flows and Network Strength
에 따르면 Crypto Onchain, a CryptoQuant analyst, Ethereum’s mid-term fundamentals remain strongly bullish despite short-term caution signals. Institutional demand is surging, with US Spot Ethereum ETFs recording a record $726.6 million in daily net inflows, driven by giants like BlackRock and Fidelity. This has pushed total ETF holdings above 5 million ETH (valued at approximately $20.3 billion), a milestone that underscores Ethereum’s growing role in institutional portfolios.
Beyond ETFs, major players are increasing direct exposure. Ark Invest purchased 30,755 ETH worth $108.57 million, while Fundamental Global allocated $200 million to ETH as part of its treasury strategy. This wave of accumulation reflects deepening confidence in Ethereum’s long-term utility and value proposition.
On-chain metrics also paint a bullish picture. Transaction volumes are hitting new highs, and staking participation continues to expand, locking up more ETH and reducing circulating supply. Regulatory clarity—such as the SEC closing investigations into liquid staking—has further strengthened structural demand for ETH. Upcoming network upgrades, including Pectra and Fusaka, are set to boost scalability and lower costs. This will enhance Ethereum’s appeal to both developers and enterprises.
In the short term, high leverage, key resistance levels, and concentrated exchange inflows pose a risk of sharp volatility. However, the mid-term outlook remains intact, supported by sustained institutional inflows, robust network growth, and technological advancements. Even if near-term corrections occur, these factors should help cap downside pressure and maintain Ethereum’s broader bullish trajectory.
Price Action Details: Setting Fresh highs
Ethereum’s 4-hour chart shows a strong breakout above the key resistance at $3,860, which had capped price action in late July. Following this decisive move, ETH surged past the $4,300 level, marking its highest point since November 2021. This rally was supported by strong bullish momentum, as seen in the steep incline of the 50-period SMA (blue) and the price holding well above the 100-period (green) and 200-period (red) SMAs.
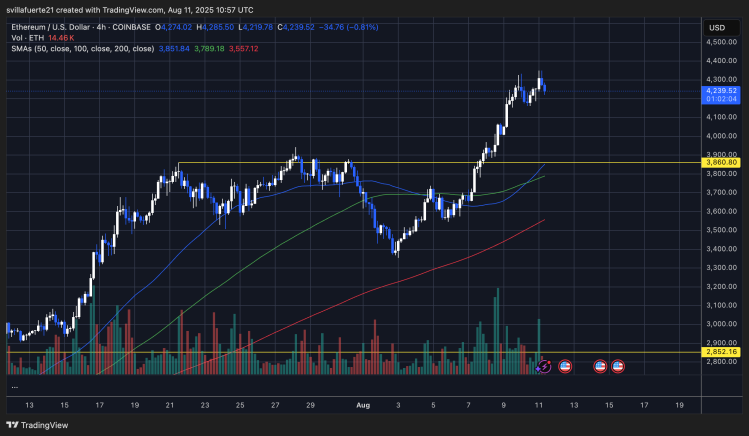
Currently, ETH is consolidating just below its recent peak, around $4,240, signaling a potential pause before the next move. This consolidation at elevated levels, rather than a sharp retracement, suggests that bulls remain in control. The $3,860–$3,900 zone now acts as a critical support, and a retest could provide a healthy setup for continuation.
Volume spikes during the breakout indicate strong buying interest, but the reduced volume in the latest candles suggests the market is waiting for fresh catalysts. A sustained move above $4,300 could open the door toward the $4,450–$4,500 zone, while a breakdown below $3,860 would weaken the bullish structure.
Featured image from Dall-E, chart from TradingView


답글 남기기