
After enduring months of aggressive selling pressure, Ethereum is finally showing signs of life. As bullish momentum slowly builds, hopes for a recovery rally are beginning to resurface. While ETH continues to trade below the key $2,000 mark, bulls are actively defending critical demand zones in an effort to reclaim lost ground and reestablish a bullish structure.
The market has been under stress for much of 2025, with Ethereum suffering extended drawdowns and repeated rejections at resistance. However, sentiment is shifting. Top analyst Ted Pillows recently shared a technical analysis noting that Ethereum has officially broken out of its downtrend for the first time since December 2024—an early sign that conditions could be improving.
This breakout marks a key shift in structure and comes as trading volume starts to recover. Traders and investors are now watching closely to see if ETH can sustain its recent strength and push back above $2,000, which remains a major psychological and technical barrier. The next few days may prove critical, as Ethereum tests its newfound momentum in a still-uncertain macro environment. If bulls succeed, a broader altcoin rally could follow.
Ethereum Consolidates As Bullish Momentum Begins to Build
Ethereum is currently trading around the $1,800 level, consolidating in a narrow range after a prolonged period of downside pressure. While the broader market begins to heat up, ETH still lacks a clear directional move and remains over 55% below its December 2024 highs. Despite this, subtle shifts in structure suggest a potential trend change, especially in the lower time frames where early bullish patterns are beginning to emerge.
The price action reflects a critical inflection point. Ethereum is hovering near major support zones, and bulls must now build enough momentum to break above key resistance levels if they want to regain control. So far, the consolidation has provided a base, but a definitive move has yet to materialize. The next leg—whether up or down—will likely be decisive for ETH’s near-term trend.
Pillows recently shared a notable technical development: Ethereum has finally broken out of its downtrend for the first time since December 2024. Previous breakout attempts were rejected, but this time the breakout appears stronger and more sustained, supported by improving market sentiment and structure.
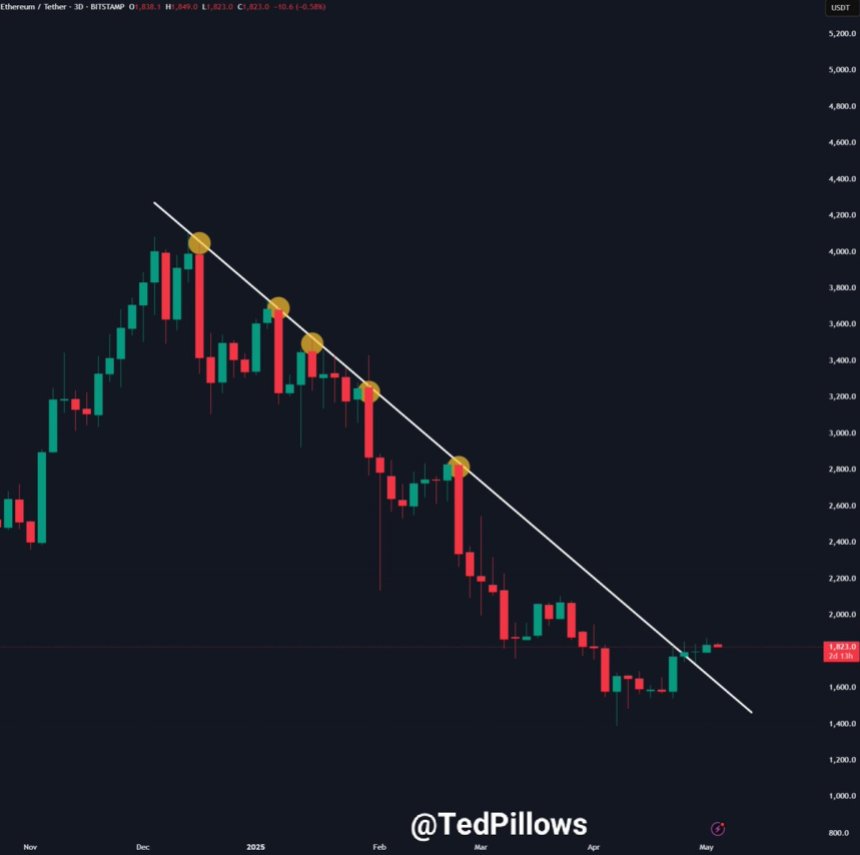
Pillows believes it’s time for Ethereum to catch up to the broader market. While Bitcoin pushes toward new highs, ETH has lagged behind. If the current breakout holds, Ethereum could accelerate quickly and potentially retest key psychological levels above $2,000. The next few trading sessions will be critical for confirming this breakout’s validity and determining whether Ethereum is ready to lead the next phase of the crypto bull cycle. For now, all eyes remain on whether bulls can maintain momentum and turn this early strength into a sustained rally.
Technical View: Bulls Struggle To Reclaim $2,000 Level
Ethereum (ETH) is currently trading at $1,807.99, consolidating in a tight range after a sharp recovery from its April lows. The 4-hour chart shows ETH holding above both the 200-period simple moving average (SMA) at $1,700.49 and the 200-period exponential moving average (EMA) at $1,783.99—two key dynamic support levels that are now being retested as the asset tries to build bullish structure.
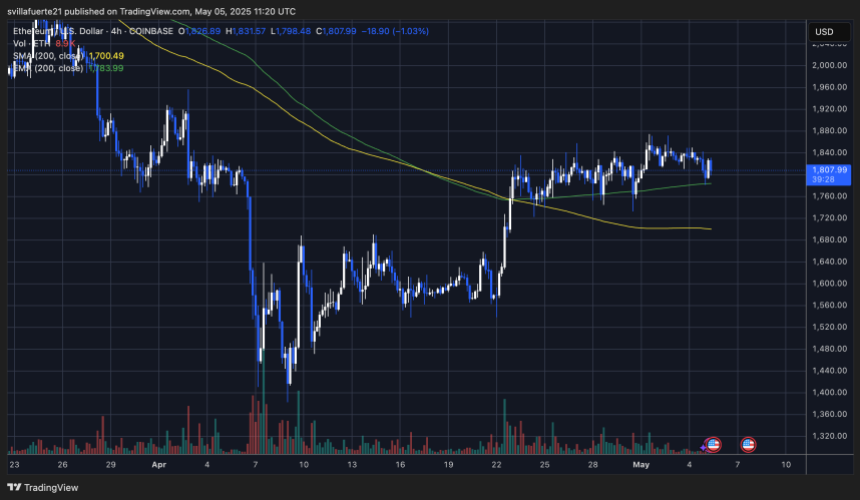
While price action remains choppy, ETH appears to be forming a base above the $1,780 zone. The recent breakout above the downtrend line that defined price action since December 2024 is still intact, suggesting that Ethereum may be preparing for a larger move. Volume has decreased slightly during this consolidation phase, typical of a market waiting for a trigger.
Ethereum continues to trade well below the psychological $2,000 resistance, but short-term momentum is slowly favoring the bulls. A break above the $1,860–$1,880 range could clear the way for a push to retest $2,000. However, failure to hold the 200 EMA could send ETH back toward the $1,740–$1,700 demand zone.
Featured image from Dall-E, chart from TradingView


답글 남기기