
Ethereum is attempting to stabilize around $1.9K after its recent recovery, but the broader technical picture remains constrained by major overhead resistance. While short-term structure has improved, ETH still needs a decisive breakout to confirm that buyers are regaining control.
Ethereum Price Analysis: The Daily Chart
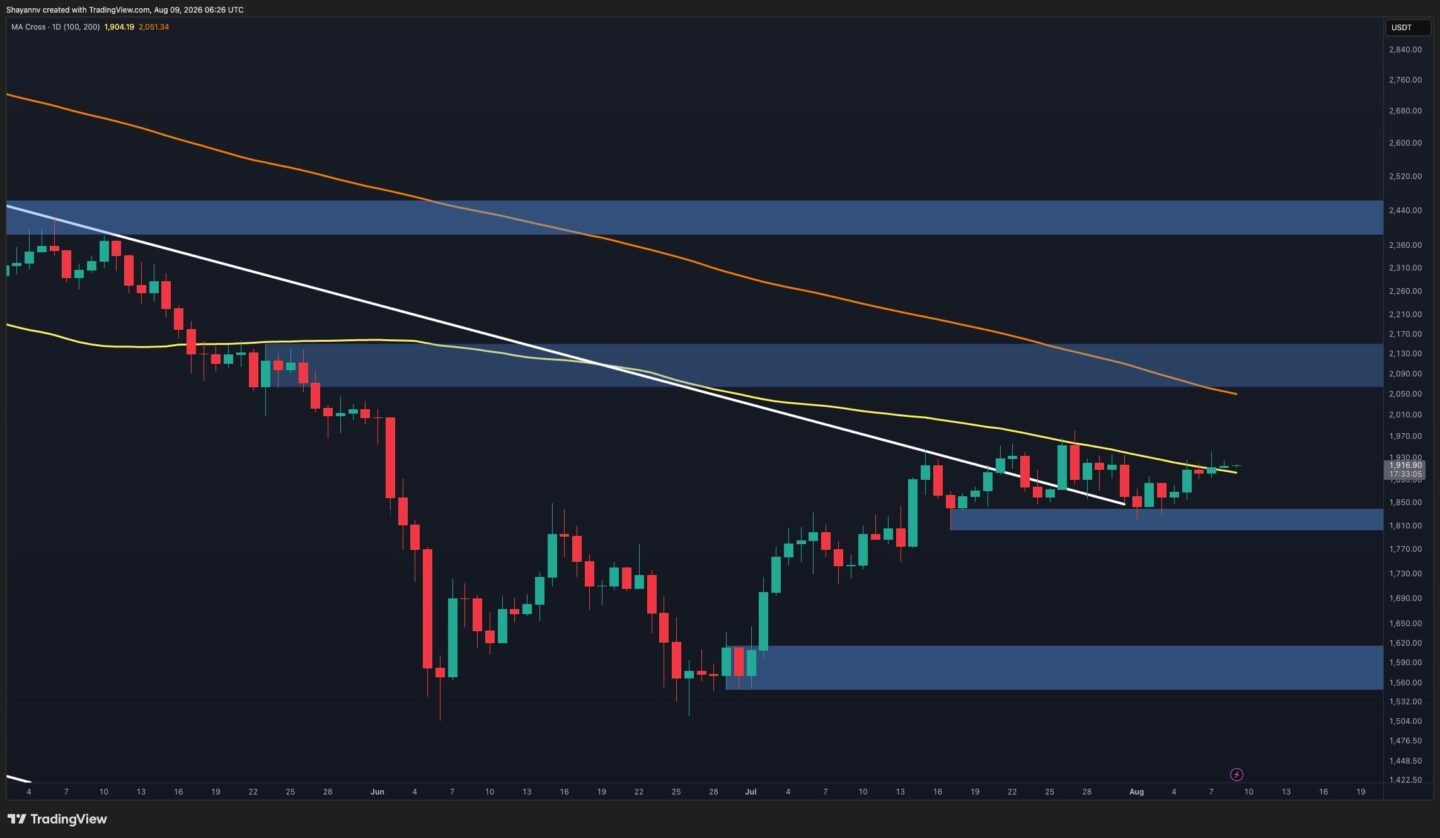
On the daily timeframe, ETH is trading around $1.92K and has recently pushed above the descending white trendline. This is a constructive development compared with the previous structure, as the trendline had acted as dynamic resistance throughout the broader decline.
However, the breakout has yet to translate into strong upside momentum. The asset is now confronting the declining 100-day moving average around $1.94K, while the larger $2.05K-$2.15K resistance zone sits directly above it. The 200-day moving average is also descending toward this region, creating a significant concentration of overhead resistance.
Therefore, the trendline breakout is an encouraging first step, but it does not yet confirm a broader bullish reversal. A sustained move above the $1.94K moving average would strengthen the case for an advance toward the $2.05K-$2.15K zone. Until that happens, rejection from current levels could send ETH back toward the $1.81K-$1.85K support region.
If that support fails, the larger $1.56K-$1.62K demand zone would become the next major downside target.
ETH/USDT 4-Hour Chart
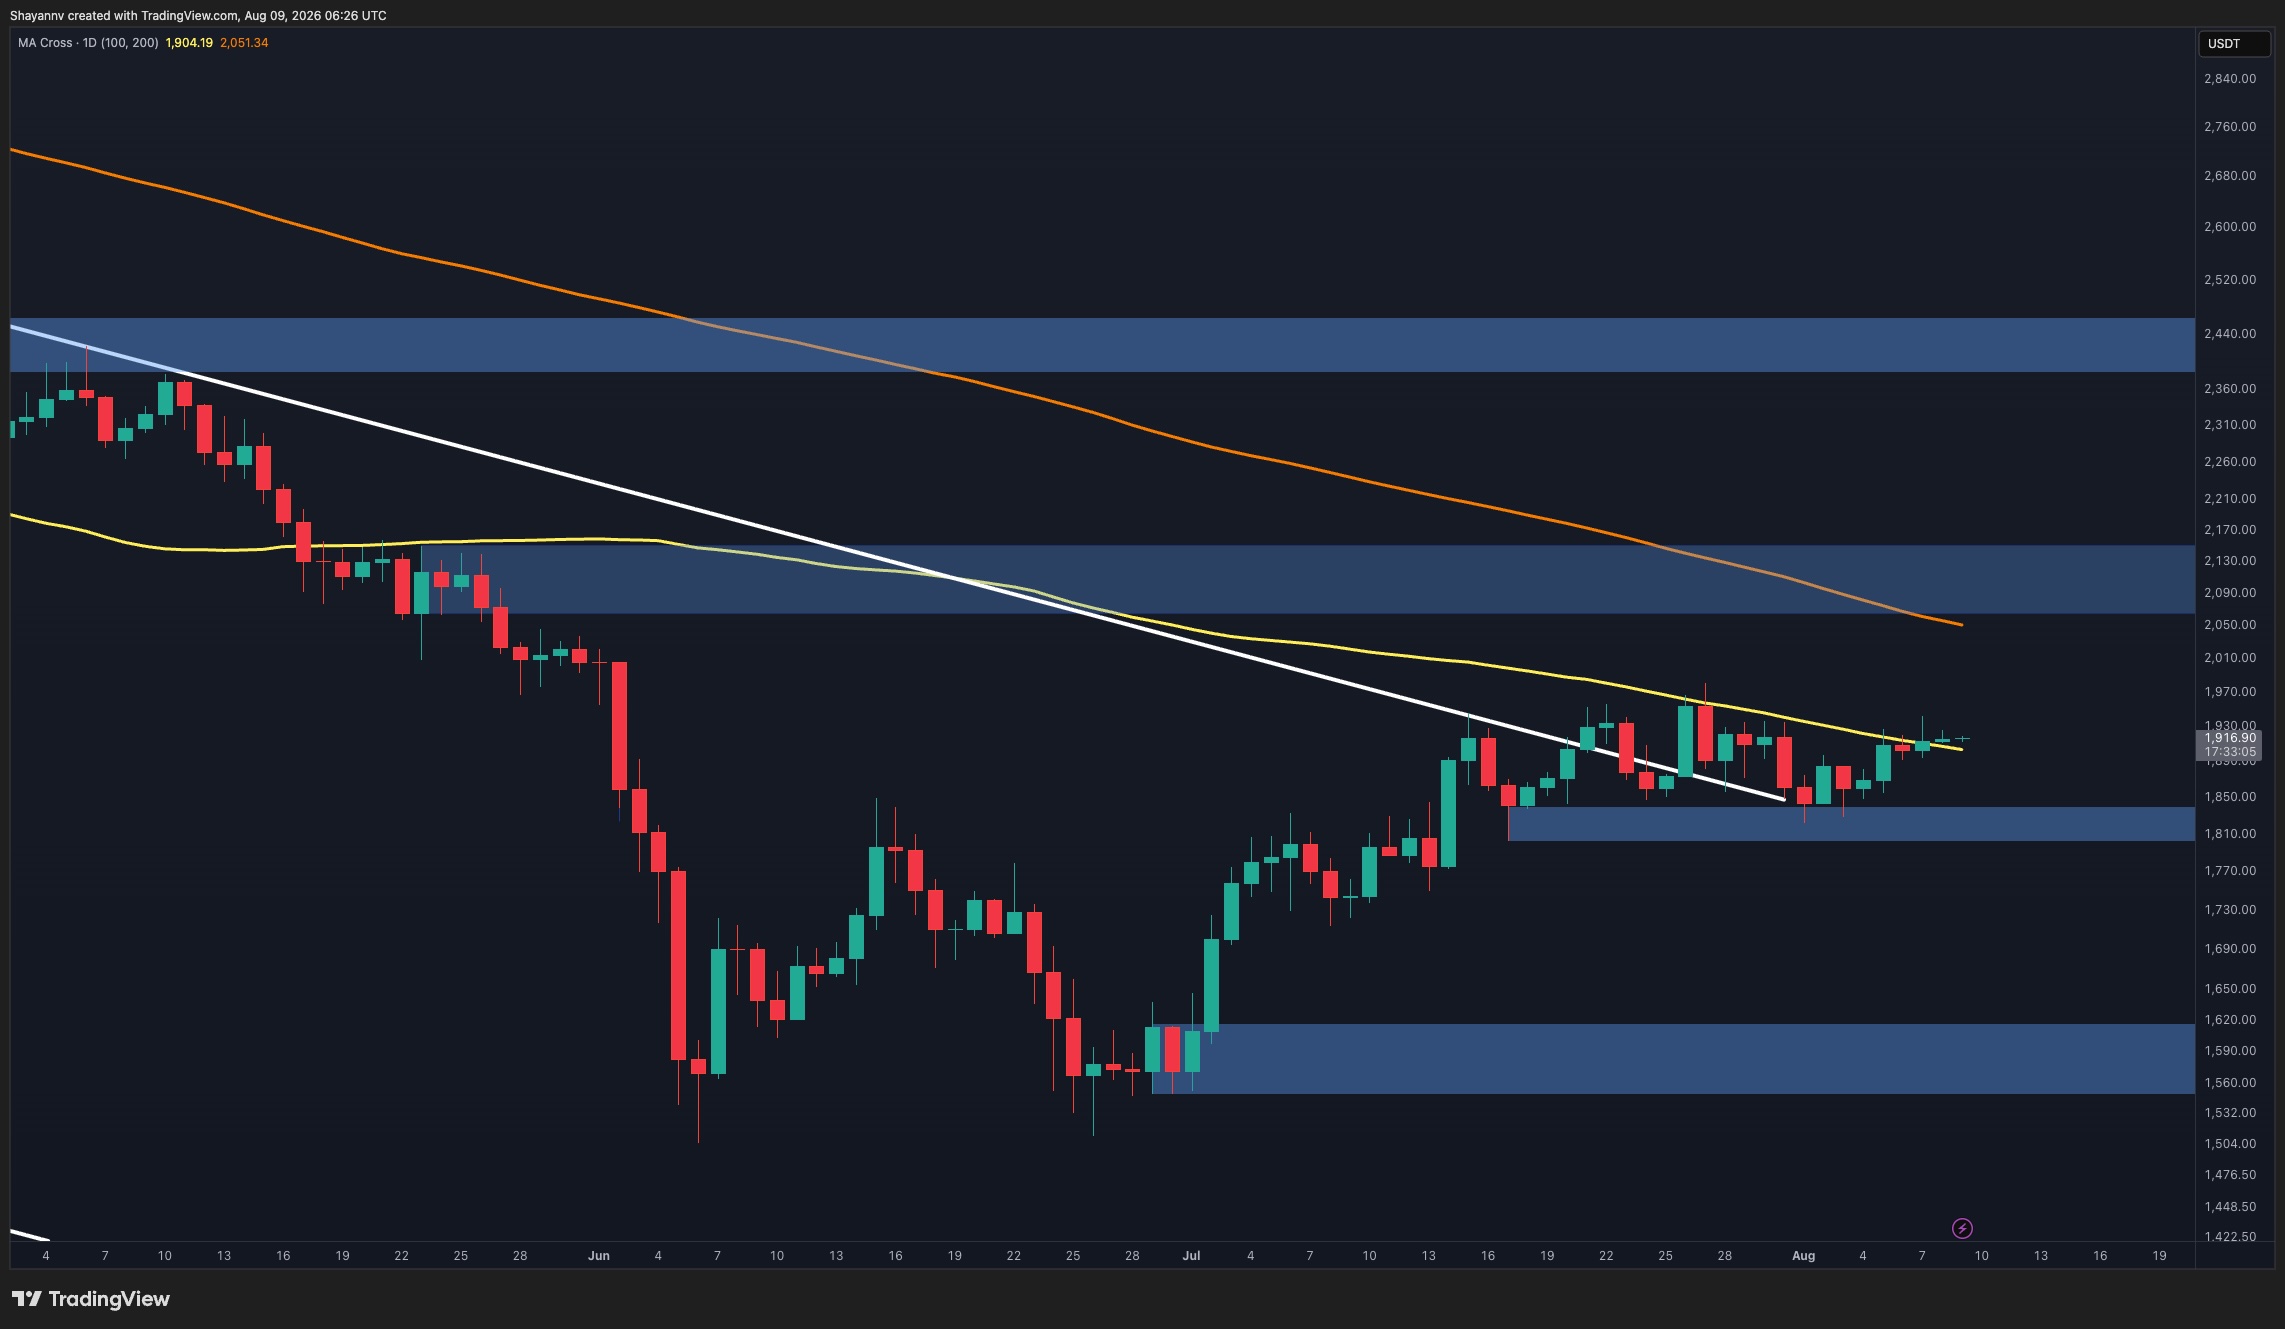
The 4-hour timeframe presents a somewhat stronger short-term picture. ETH has rebounded from the $1.80K-$1.84K support zone and is now consolidating near $1.92K after establishing a sequence of higher lows from the early-August bottom.
Nevertheless, buyers are approaching a crucial test. The $1.95K-$1.98K resistance box marks the immediate supply zone and previously triggered a sharp rejection in late July. Price is currently consolidating just beneath this area, suggesting that the market is preparing for another attempt.
A breakout above the $1.95K-$1.98K region would likely open the door toward $2K and the upper boundary of the broader ascending structure. Conversely, another rejection would leave ETH vulnerable to a retracement toward the $1.80K-$1.84K support box.
The short-term bias has consequently improved, but confirmation still depends on buyers successfully clearing the resistance immediately overhead.

Sentiment Analysis
Ethereum’s funding-rate chart provides an interesting backdrop to the latest recovery. Funding rates measure the periodic payments between long and short perpetual-futures traders, with positive readings generally indicating that leveraged positioning is tilted toward longs.
The 14-period funding-rate EMA remains positive at roughly 0.006, but it has fallen substantially from its June peak near 0.01. At the same time, ETH has begun recovering toward $1.9K from its recent lows.
This divergence suggests that price is recovering without a comparable increase in leveraged-long enthusiasm. That can be constructive because the advance appears less dependent on increasingly crowded bullish positioning, reducing the immediate risk associated with excessive positive funding.
Still, funding remains above zero, meaning longs continue to pay shorts, and bullish positioning has not disappeared. If ETH breaks the $1.95K-$1.98K resistance zone while funding remains relatively contained, the move could have a healthier derivatives backdrop. A renewed surge in funding without a corresponding price breakout, however, would signal increasing leverage and raise the risk of another long-side flush.

게시물 Ethereum Price Analysis: Is ETH Primed for a Move to $2K Next Week? 에 처음 등장 크립토포테이토.










 한국어
한국어  English
  Română
  Eesti
Eesti  日本語
日本語  Русский
  Deutsch
  Español
  简体中文
简体中文  Français
  繁體中文
繁體中文  Português
  Italiano
  Polski
  Türkçe
  Nederlands
  Bahasa Indonesia
  Ελληνικά
  Українська
  Български
  Čeština
  Suomi
Suomi  Magyar
  Latviešu valoda
  Lietuvių kalba
  Norsk bokmål
  Slovenčina
  Slovenščina
  Svenska
답글 남기기