Bitcoin is trading at $78k, closing out the final week of April with a quiet but persistent grind higher that has now taken price above the $75k–$80k resistance band’s midpoint. The move has been orderly rather than explosive, and that measured character, combined with what the derivatives market is currently showing, may actually be setting up a more powerful move than most expect.
Bitcoin Price Analysis: The Daily Chart
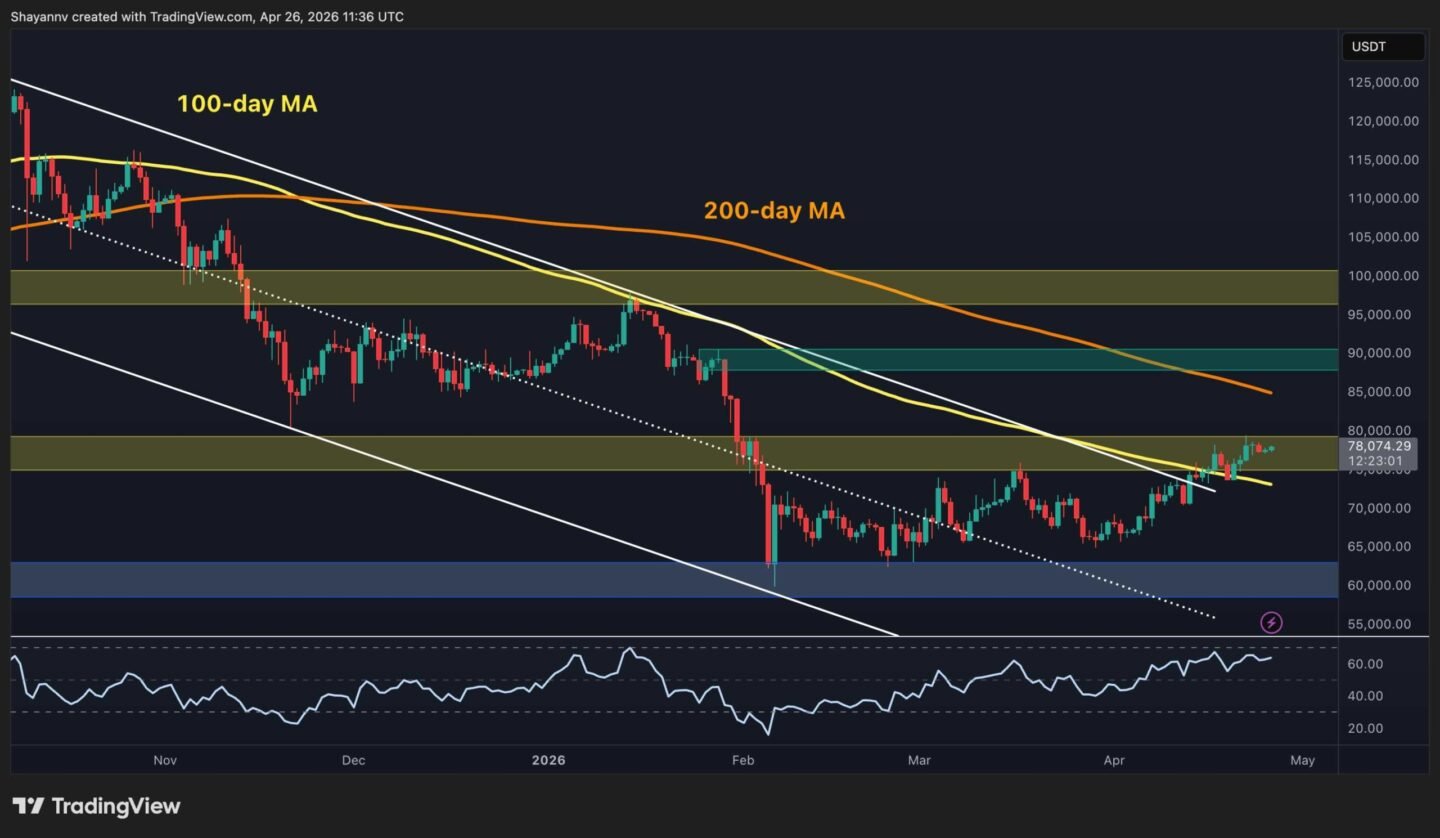
The daily structure continues to improve. BTC has now spent several consecutive sessions above the former descending channel, the 100-day MA has been reclaimed, and the RSI is trending upward toward around high-60s, which shows building momentum rather than exhaustion. The $75k–$80k resistance zone is now being systematically reclaimed from within.
The next meaningful test sits at $80k, which is both a psychological round number and the upper boundary of the current resistance band. Above it, the $88k–$90k zone and the 200-day moving average around $85k form a significant supply cluster that can become the primary target.
What is notable on the daily is that each pullback over the past three weeks has found support at higher levels, a classic sign of demand building beneath the price rather than waning. The $74k–$75k area and the 100-day moving average nearby are now the first support levels to protect, as a close below them would be the earliest warning signal that the breakout is stalling.

BTC/USDT 4-Hour Chart
The 4-hour chart has developed an interesting two-layer structure. The broader ascending channel from the February lows frames the overall recovery, while a steeper short-term trendline that emerged in early April has acted as the actual engine of the recent push, driving price from around $68k all the way to current levels near $78k in three weeks.
BTC is currently riding the upper half of the broader channel while the steeper trendline continues to provide dynamic support, now near $77k. The RSI is also hovering around 60, which is elevated but not flashing overbought signals. The upper boundary of the broader channel near $79k–$80k coincides with the key resistance level, making that zone the natural near-term ceiling.
A sustained close above $80k would represent a breakout from both the channel and the psychological resistance level simultaneously, which is a confluence that would carry significant technical weight.

Sentiment Analysis
Sentiment-wise, there is a paradox that the funding rate chart presents. Despite BTC trading at $78k, which is its highest level since February, funding rates across all exchanges remain firmly negative, currently reading around -0.014. The red bar dominance that began in February has not resolved, even as the price has rallied more than 20% from the lows. Traders are still paying to hold short positions at levels that are approaching two-month highs.
This is not a warning sign, but more like a structural advantage for buyers. A market where funding is persistently negative while price rises means the rally is being fought, not embraced, by derivatives traders. Every short position opened against this move is a potential source of forced buying if the price continues higher.
When BTC eventually triggers a wave of short liquidations, and at $78k with heavily negative funding, the threshold for such a cascade is not far away. The buying pressure generated by covering shorts can amplify price moves significantly beyond what spot demand alone would produce. The fuel for a sharp move toward $85k–$90k is sitting right there in the derivatives market, waiting to be ignited.

게시물 Bitcoin Price Prediction: What Is BTC’s Most Likely Move in the Next Few Days 에 처음 등장 크립토포테이토.


답글 남기기