XRP is trading at a critical juncture, struggling to hold support below the $2.5 mark after weeks of heavy selling pressure. Bulls are finding it increasingly difficult to regain control, and overall sentiment across the market remains weak following sharp declines in major altcoins. Yet, some analysts argue that this exhaustion phase could represent a local bottom — a setup that historically precedes strong rebounds in XRP’s price.
According to data shared by CryptoQuant analyst CryptoOnchain, the XRP Ledger’s decentralized exchange (DEX) has shown a striking divergence between price and activity. Between October 8th and 17th, as XRP’s price plunged from around $3.0 to $2.3, DEX trading volume spiked to a multi-month high. This surge in activity, highlighted in the greyed-out region of the chart, signals that despite price weakness, on-chain engagement remains robust.
This type of divergence often sparks debate among traders — it can either indicate capitulation, where sellers are finally giving up, or accumulation, where larger players quietly enter the market. With DEX activity heating up while price stagnates, the coming days could be decisive for XRP’s next move, as traders watch closely for signs of a potential reversal.
Price-Volume Divergence Signals a Market Turning Point
CryptoQuant analyst CryptoOnchain highlights that the recent divergence between XRP’s price and DEX volume can be interpreted in two opposite but crucial ways. The first is Capitulation and Selling Pressure, a bearish scenario where the surge in trading volume during a price decline reflects panic selling. In this case, the spike in activity represents a rush to exit — the capitulation of short-term holders and traders unwilling to hold through further losses. Historically, such events confirm strong bearish momentum as sellers dominate the market, often leading to temporary breakdowns before stabilization.

On the other hand, the second possibility points to Accumulation by Smart Money. Here, the sharp increase in volume may not signal panic, but rather strategic positioning by large investors or whales taking advantage of discounted prices. While retail participants sell out of fear, long-term players could be absorbing supply, positioning for a potential recovery. This dynamic — the transfer of XRP from “weak hands” to “strong hands” — has historically preceded major reversals.
Ultimately, this period underscores a fierce battle between buyers and sellers. Despite the drop in price, the presence of heavy buying interest suggests underlying strength. If demand continues to absorb selling pressure, XRP could be forming a foundation for its next bullish impulse. The $2.3–$2.5 zone now stands as a critical area to watch for signs of accumulation and a potential market rebound.
XRP Attempts to Stabilize After Sharp Sell-Off
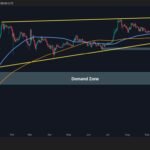
XRP is showing early signs of stabilization after one of its sharpest corrections of the year. The chart shows that the token rebounded from lows near $2.3, a level that aligns closely with the 100-day moving average — now acting as short-term support. Despite the recovery to around $2.47, the structure remains fragile, with the 50-day moving average trending downward and the price still below the key $2.6–$2.7 resistance zone.

This area previously served as strong support before being broken during the recent sell-off, suggesting that it could now act as a barrier for bullish continuation. The broader trend also highlights a significant increase in volatility, reflecting uncertainty among traders. The long lower wick on recent candles indicates that buyers are defending the $2.3 level, but without a clear volume expansion, a sustained reversal remains uncertain.
If XRP holds above $2.3, a short-term consolidation phase could follow, potentially leading to a retest of $2.6. However, if selling pressure returns and price slips below $2.3, a deeper pullback toward the 200-day moving average near $1.8 cannot be ruled out. For now, XRP’s outlook depends on whether bulls can turn this temporary bounce into a confirmed recovery.
Featured image from ChatGPT, chart from TradingView.com


コメントを残す