
BNB price is consolidating losses below the $1,200 zone. The price is now facing hurdles near $1,250 and might start another decline in the near term.
- BNB price is correcting gains and traded below the $1,200 support zone.
- The price is now trading below $1,180 and the 100-hourly simple moving average.
- There is a short-term bearish trend line forming with resistance at $1,180 on the hourly chart of the BNB/USD pair (data source from Binance).
- The pair must stay above the $1,120 level to start another increase in the near term.
BNB Price Dips Below Support
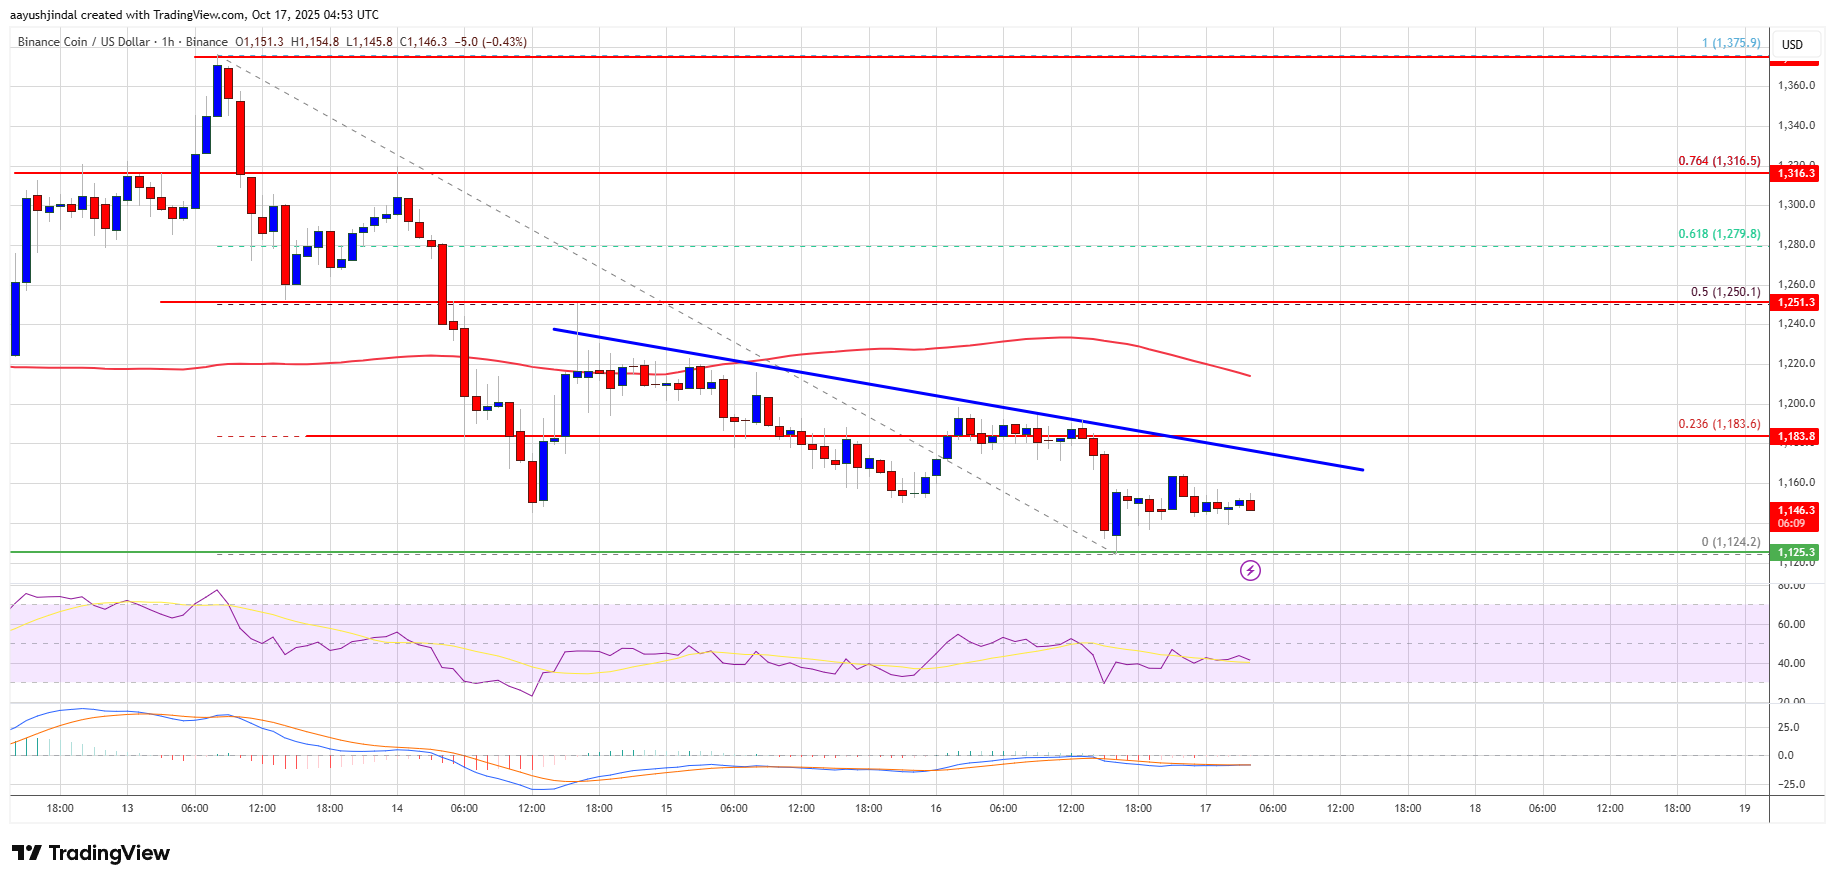
After a steady increase, BNB price failed to clear the $1,375 zone. There was a downside correction below the $1,300 and $1,250 levels, like イーサリアム そして ビットコイン.
The price even dipped below $1,200 and tested $1,125. A low was formed at $1,124, and the price is now consolidating losses below the 23.6% Fib retracement level of the downward move from the $1,375 swing high to the $1,124 low.
The price is now trading below $1,180 and the 100-hourly simple moving average. Besides, there is a short-term bearish trend line forming with resistance at $1,180 on the hourly chart of the BNB/USD pair.
On the upside, the price could face resistance near the $1,180 level. The next resistance sits near the $1,200 level. A clear move above the $1,200 zone could send the price higher. In the stated case, BNB price could test $1,250 and the 50% Fib retracement level of the downward move from the $1,375 swing high to the $1,124 low.
A close above the $1,250 resistance might set the pace for a larger move toward the $1,320 resistance. Any more gains might call for a test of the $1,350 level in the near term.
Another Decline?
If BNB fails to clear the $1,200 resistance, it could start another decline. Initial support on the downside is near the $1,125 level. The next major support is near the $1,100 level.
The main support sits at $1,065. If there is a downside break below the $1,065 support, the price could drop toward the $1,000 support. Any more losses could initiate a larger decline toward the $950 level.
テクニカル指標
Hourly MACD – The MACD for BNB/USD is gaining pace in the bearish zone.
Hourly RSI (Relative Strength Index) – The RSI for BNB/USD is currently below the 50 level.
Major Support Levels – $1,120 and $1,100.
Major Resistance Levels – $1,200 and $1,250.


コメントを残す