

Ethereum is attempting to stabilize around $1.8K after a steep November sell-off that erased the asset’s entire August rally.
With daily momentum in oversold territory and ETH trading just above a major demand zone, the coming sessions could decide whether a relief rally develops or sellers extend the decline.
Meanwhile, a sharp rise in Ethereum’s active addresses points to a sudden increase in network activity, although the signal remains open to more than one interpretation.
Ethereum Price Analysis: The Daily Chart
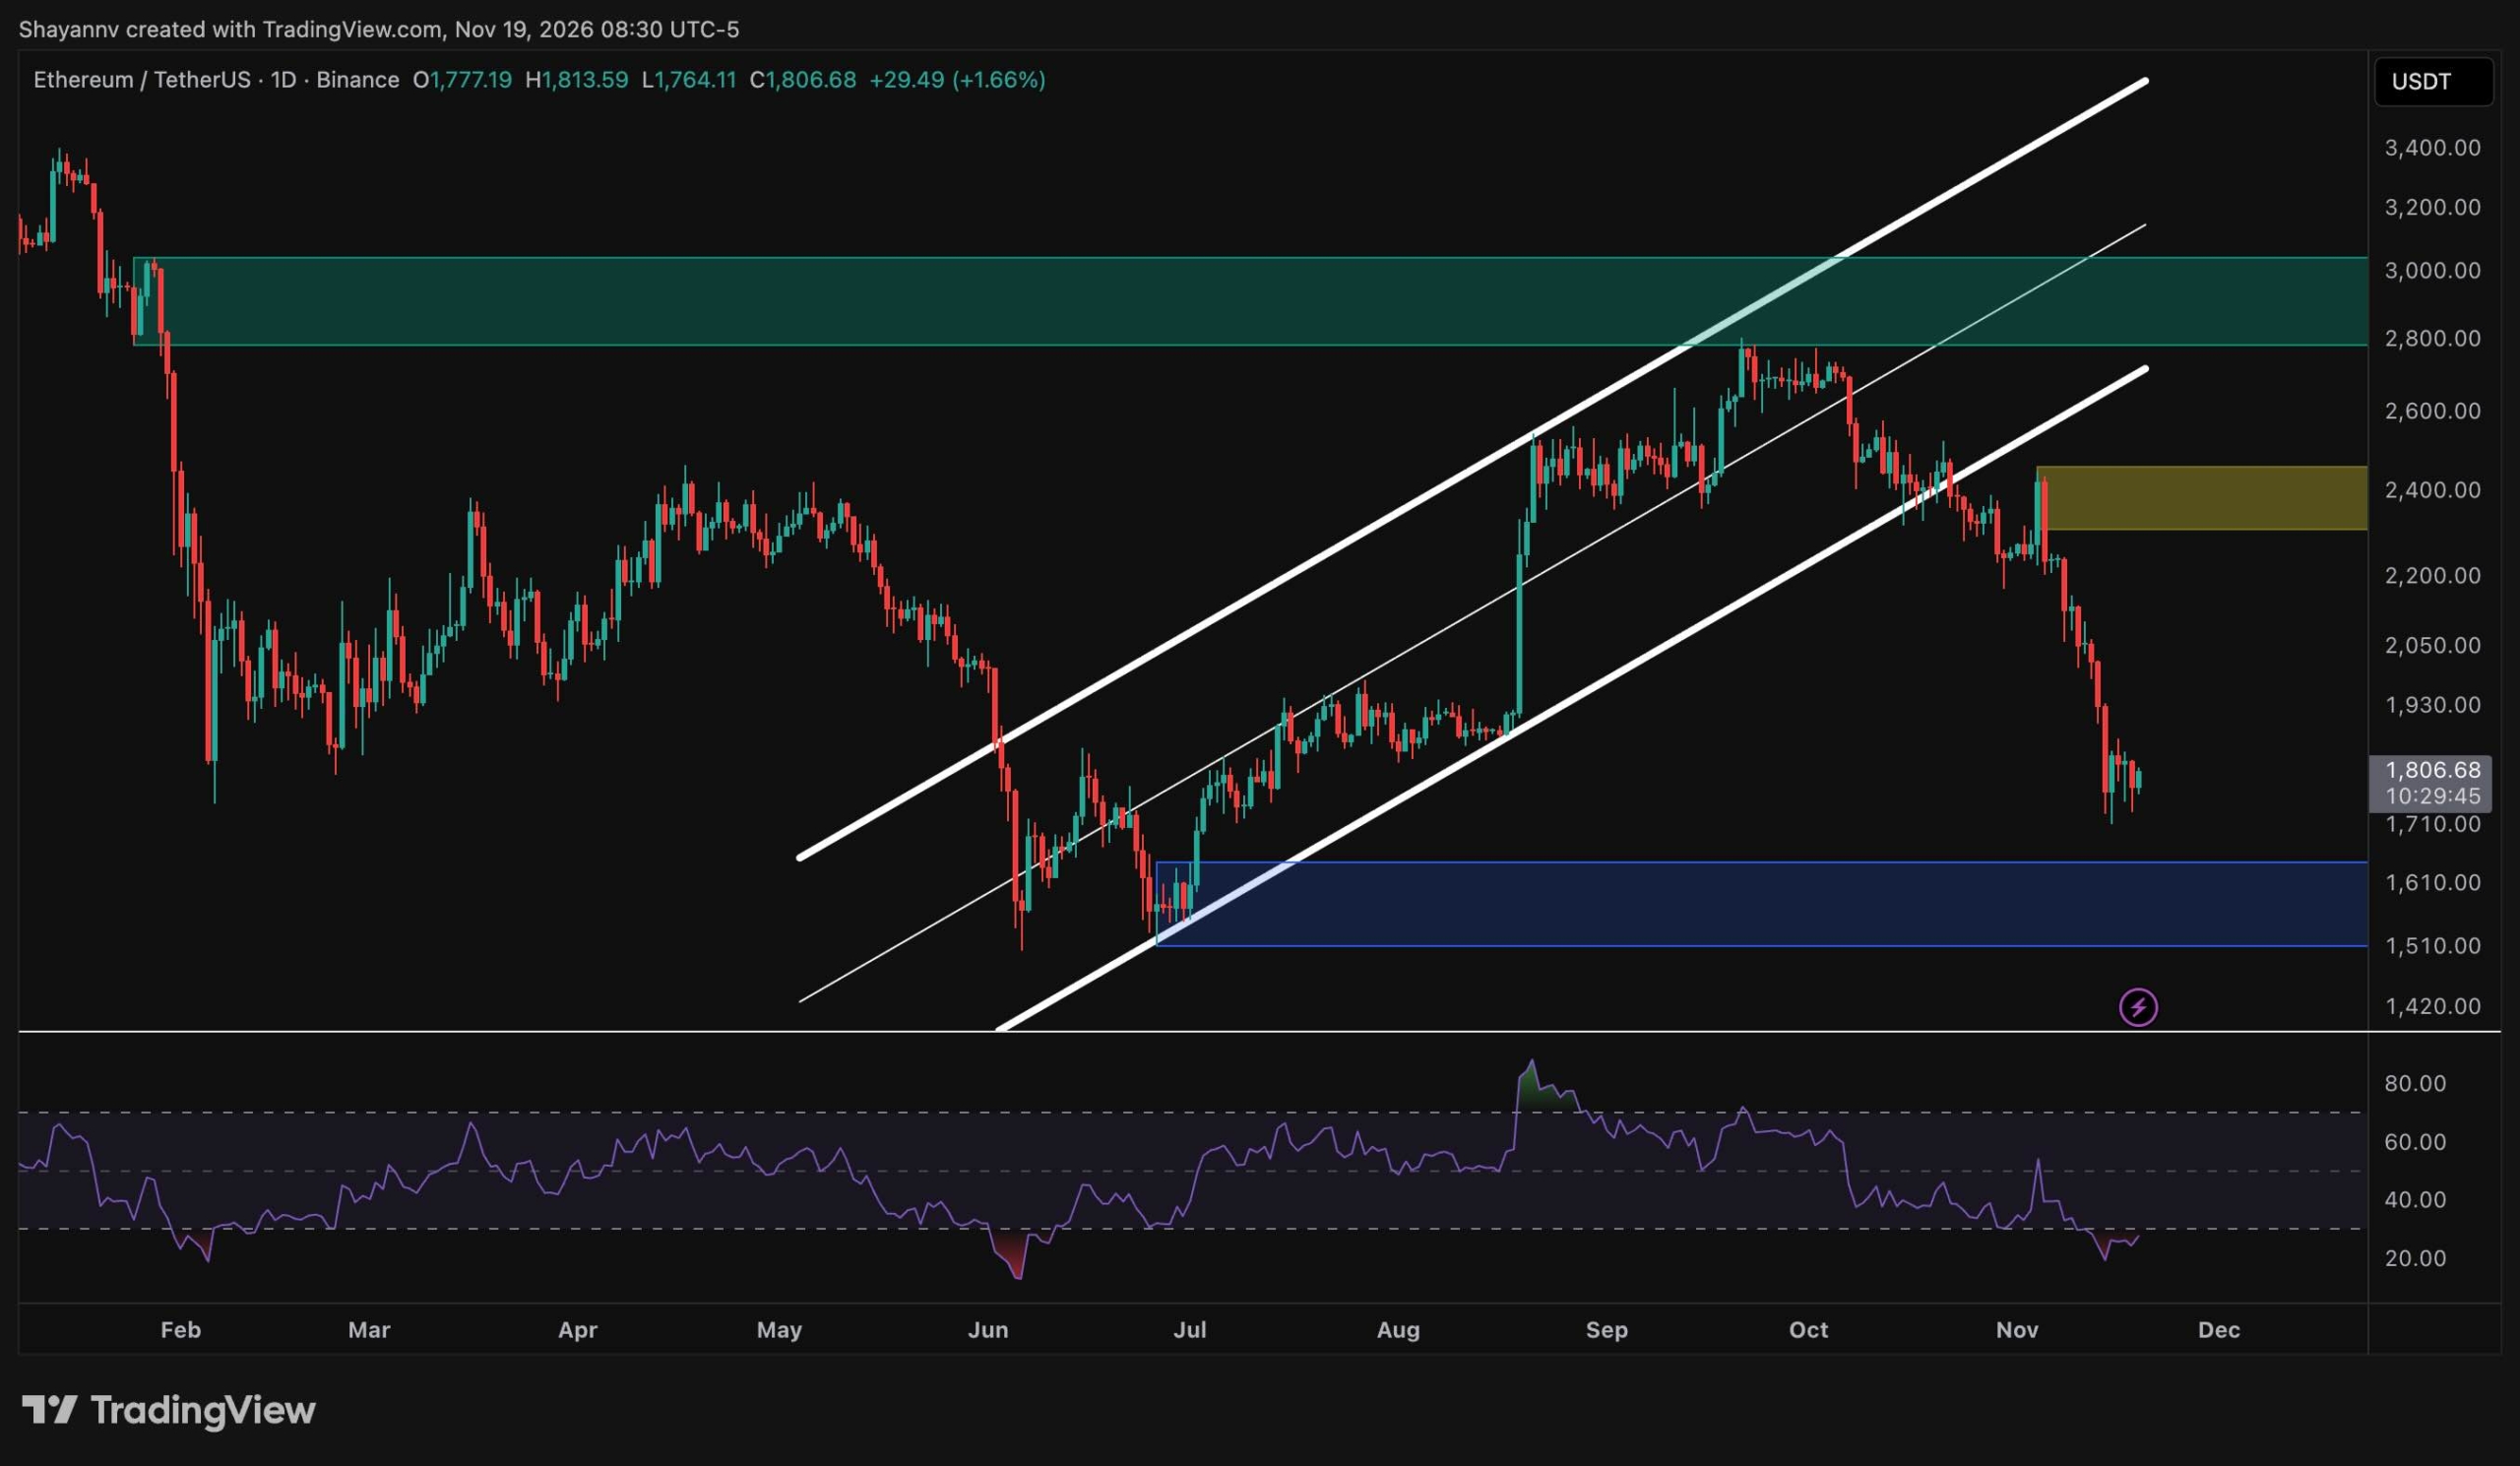
On the daily timeframe, ETH broke below the ascending channel that had guided its recovery from the June lows in October. The early-November retest of the broken structure ended with a sharp rejection from the $2.4K area, which created a strong bearish order block.
After that rejection, the sell-off accelerated, and the price fell through the psychological $2K level before printing a low of around $1.7K.
The asset now trades near $1.8K, above the $1.5K-$1.6K demand zone, which formed the base of the June–July accumulation before the channel’s advance began.
To improve the outlook, buyers would first need to reclaim $2K, with the $2.4K order block as the more decisive test. On the other hand, a decisive daily close below the recent low of $1.72K would likely expose the $1.5K-$1.6K demand zone.
The daily RSI has also dropped to approximately 25, its first stay below the 30 threshold since June, when a similar oversold reading came shortly before a recovery. Oversold conditions can persist during strong downtrends, however. A move back above 30, and eventually 50, would be needed to show that bearish momentum is fading.
ETH/USDT 4-Hour Chart
The 4-hour chart shows a clear sequence of lower highs. Each breakdown leg has left behind a supply zone at $2.7K, $2.4K, $2.1K, and most recently $1.9K.
In the past few sessions, ETH has been ranging between roughly $1.7K and $1.85K. The latest dip held around $1.74K, slightly above the prior low.
If buyers can build on this base, a relief bounce could reach the $1.9K supply zone, which is the first meaningful overhead barrier.
Clearing it would ease the immediate bearish pressure and bring $2.1K into view. Conversely, losing the $1.7K low would end the consolidation and could push the price toward $1.6K, the upper edge of the daily demand zone.
Meanwhile, the 4-hour RSI has recovered from below 30 to approximately 45. This suggests that short-term selling pressure is easing, but the indicator remains below the neutral 50 level. A sustained move above 50 together with a break of $1.85K would make the stabilization attempt more convincing.

On-Chain Analysis
CryptoQuant’s Active Addresses metric counts the unique addresses that send or receive ETH each day, and the 30-day exponential moving average smooths out daily noise. Rising readings generally point to growing network participation. However, the metric does not show whether that activity comes from buying or selling.
That ambiguity shows up clearly in the chart’s history. The EMA climbed alongside ETH’s 2025 rally toward roughly $4.8K, but its highest reading, around 715K in February 2026, came during a sharp price decline from approximately $3.3K toward $2K. More recently, the EMA has jumped from roughly 375K to about 485K, while ETH fell to $1.8K.
Given the February precedent, the latest surge could reflect capitulation-driven transfers rather than fresh demand. If ETH holds $1.7K and reclaims $1.9K while activity stays elevated, the more constructive reading would gain weight. Without that, the spike may simply signal heightened stress.

ポスト Ethereum Price Analysis: Is ETH About to Explode or Crash Below $1.7K? に初登場した。 クリプトポテト.












 日本語
 English
 Română
 Eesti
 한국어
 Русский
 Deutsch
 Español
 简体中文
 Français
 繁體中文
 Português
 Italiano
 Polski
 Türkçe
 Nederlands
 Bahasa Indonesia
 Ελληνικά
 Українська
 Български
 Čeština
 Suomi
 Magyar
 Latviešu valoda
 Lietuvių kalba
 Norsk bokmål
 Slovenčina
 Slovenščina
 Svenska
コメントを残す