Fidelity Digital Assets says Bitcoin’s latest drawdown has pushed the market into a zone that has historically aligned with accumulation phases, even as its momentum signal remains negative and broader crypto risk appetite stays narrow.
In its Signals Report Q2 2026, Fidelity’s research team described a market still working through a corrective phase rather than entering a broad-based expansion. Bitcoin remains the dominant source of unrealized profitability across the digital asset complex, while other major assets continue to stabilize after a sharp reset in Q1.
Fidelity Says Bitcoin Looks Undervalued
The report’s clearest Bitcoin price signal comes from the asset’s “Yardstick,” a valuation framework that compares Bitcoin’s market capitalization to hash rate. Fidelity rated the metric positive, noting that falling prices and a pullback in hash rate have pushed the indicator into what it calls an “undervalued” zone.
“Historically, this undervalued zone has aligned with accumulation phases and relative bottoms,” the report stated.
According to Fidelity, Bitcoin spent 71 of the previous 91 days, or 78% of the period, below negative one standard deviation of the Yardstick’s mean. The condition first appeared in October 2025 and was amplified by two cold-weather events in the United States that temporarily curtailed mining activity as operators reduced power usage to support local grid stability.
That nuance matters. Fidelity does not frame the hash-rate decline purely as a sign of deteriorating miner confidence. The report said some analysts have linked the decline to miners shifting toward AI workloads, but argued the move could also reflect demand-response programs, especially in regions such as Texas where miners routinely power down during peak grid demand.
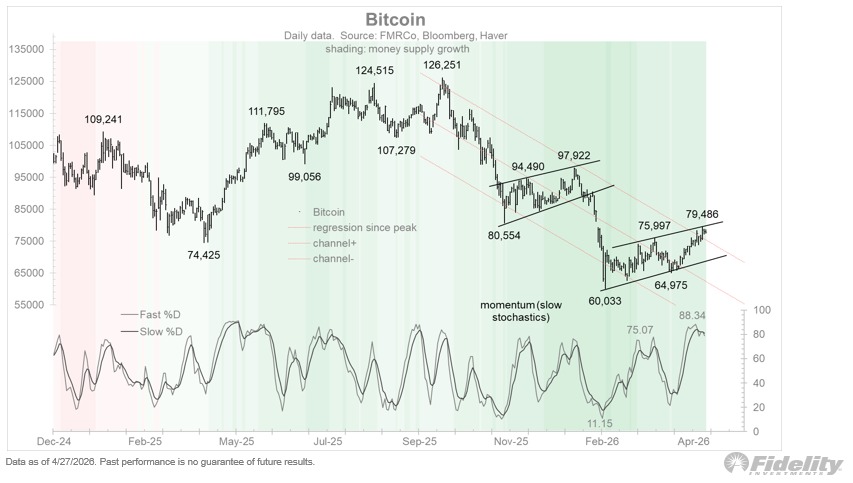
The price backdrop remains difficult. Fidelity’s momentum signal for Bitcoin turned negative on October 18, 2025, when BTC traded near $107,000. Since then, Bitcoin has fallen roughly 36%, with most of Q1 2026 spent in a defined range between $62,500 and $76,022. The firm said that pattern is more consistent with consolidation than a renewed trend.
“This signal is not designed to identify precise tops or bottoms,” Fidelity wrote, adding that the current reading points to stabilization rather than fresh upside momentum.
Bitcoin’s NUPL score also reflects a cautious market. Fidelity said BTC’s net unrealized profit/loss stood at 0.21 at the end of Q1 2026, placing investors in the “Hope-Fear” zone. That reading suggests some holders remain in profit, but the market has not yet established broad conviction that a durable bottom is in place.
The historical setup is more constructive. Fidelity found that prior periods when Bitcoin’s NUPL hovered around 0.21, plus or minus 0.01, coincided with a median one-year return of 63% and a three-year compound annual growth rate of 74%. The firm emphasized, however, that these historical relationships may weaken or fail to persist, particularly when macro conditions dominate digital asset flows.
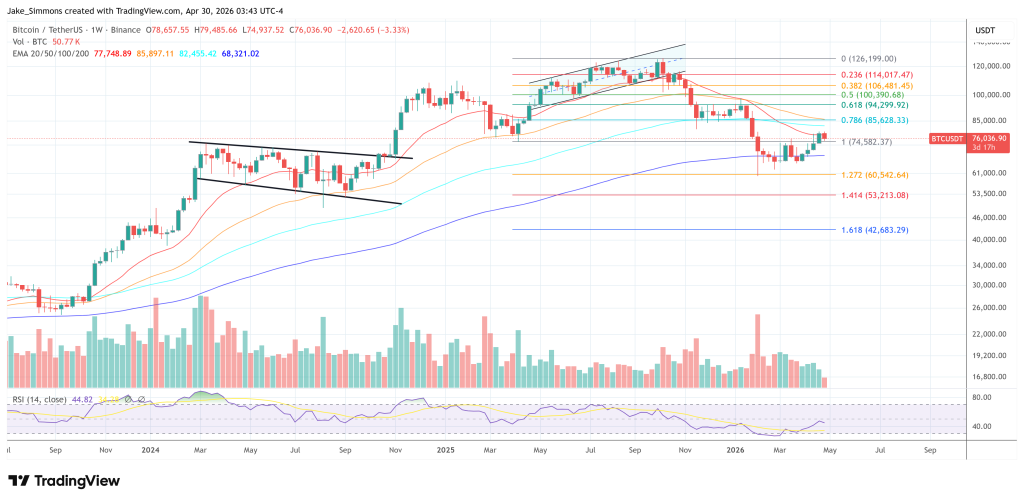
Separately, Fidelity’s Jurrien Timmer pointed to a more tactical Bitcoin setup, sharing a chart that shows BTC testing the upper boundary of what he described as a potential bear flag. The chart places Bitcoin near $79,486 after its rebound from the February low around $60,033, with momentum indicators moving back into overbought territory.
Timmer framed the current setup as an important technical test. “Technical Analysis 101 states that when bear market rallies get overbought, it’s usually the kiss of death and time to sell,” he wrote. “However, during bull markets overbought momentum means that the market is strong and likely to stay strong.”
His conclusion sharpened the price question raised by Fidelity’s broader report: whether Bitcoin is still trapped in a corrective structure or beginning to transition into a new bull phase. “If Bitcoin cannot be pulled down by this current combination of overbought momentum and trendline resistance, then this is an emerging bull market and not a bear market rally,” Timmer said, adding that this has been his “hunch all along” and “may be about to get confirmed.”
At press time, BTC traded at $76,036.


コメントを残す