
TRX is showing remarkable strength as the broader crypto market accelerates, with Bitcoin testing a new all-time high and altcoins following closely behind. Amid this renewed momentum, top analyst Darkfost shared key insights highlighting that TRX’s underlying trend no longer needs confirmation — it remains clearly positive. The asset has maintained a steady bullish structure even through periods of consolidation, suggesting a strong foundation for the next move.
Darkfost also pointed out that a particularly interesting signal has now appeared — one that historically precedes a new phase of acceleration for TRX. This signal, based on trading volume dynamics, reflects a cooling-off period that often marks the calm before a major breakout. Previous occurrences of similar setups have led to substantial rallies, reinforcing growing optimism among traders.
As the market regains momentum, TRX stands out for its consistent resilience and steady performance. The combination of a solid long-term uptrend and favorable onchain metrics is fueling expectations of a possible breakout in the days ahead. With Bitcoin leading sentiment and altcoins gaining traction, TRX could be positioning itself as one of the strongest performers in this phase of the crypto market.
TRX Market Structure: Cooling Volumes Hint at a Potential Breakout
According to Darkfost, the Spot Volume Bubble Map — a tool that visualizes periods of trading volume expansion and contraction — is currently flashing a notable cooling signal for TRX. The indicator shows that spot volumes have dropped significantly over the past few sessions, a pattern that often precedes renewed volatility. While low activity might seem like a lack of market interest, history suggests otherwise for TRX.
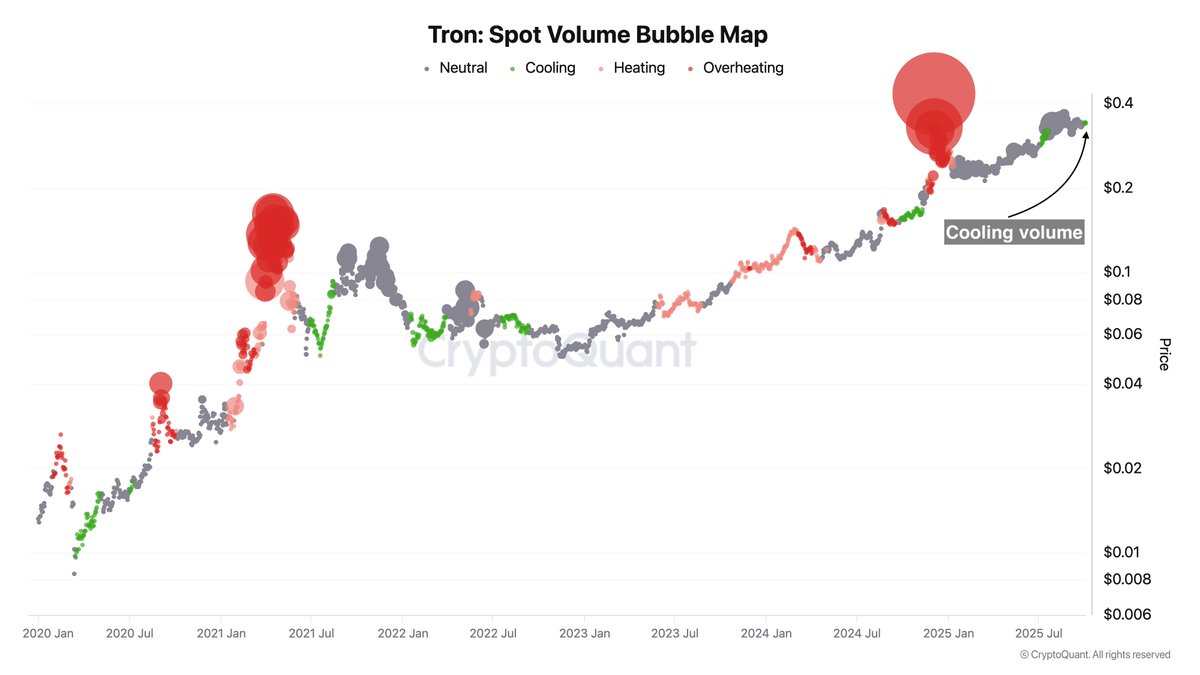
Darkfost notes that similar conditions have frequently preceded major bullish moves. For instance, in July 2021, when TRX’s volumes cooled sharply, the price soon surged from $0.05 to $0.12. A comparable setup occurred again in October 2024, followed by an impressive rally from $0.15 to $0.43. In both cases, a decline in trading activity was not a sign of weakness — it was the setup phase for accumulation by long-term players positioning ahead of the next breakout.
The current cooling phase, therefore, might represent a consolidation period rather than the end of momentum. As price action stabilizes and volatility compresses, TRX is forming a strong support base, allowing smart money to quietly accumulate positions. If market liquidity returns with Bitcoin and altcoins pushing higher, this structure could serve as the springboard for a short-term rebound — or potentially the start of a new acceleration phase for TRX.
TRX Price Analysis: Consolidation Before Potential Upside

TRX is currently trading around $0.344, showing resilience as it consolidates near short-term resistance. The chart reveals a steady recovery from late September lows near $0.32, with price now stabilizing above both the 50-day and 200-day moving averages, signaling a healthy medium-term structure.
The 50-day MA (blue) is starting to curve upward, suggesting renewed momentum, while the 200-day MA (red) continues to provide a strong long-term support base. This setup mirrors several previous consolidation phases where TRX built strength before breaking higher. The green 100-day MA also aligns closely with current price action, forming a convergence zone that often precedes volatility expansion.
Resistance remains at $0.35–$0.36, a key level that has repeatedly capped upside attempts since early September. A confirmed breakout above this zone could open the door toward $0.38–$0.40, resuming the broader bullish trend seen earlier in the year. On the downside, immediate support lies near $0.33, followed by $0.32, which has held firm through multiple retests.
Featured image from ChatGPT, chart from TradingView.com


コメントを残す