

Bitcoin is trading at a critical level after successfully holding above $110,000 as support, but market sentiment remains on edge. The recent defense of this zone has given bulls a temporary cushion, yet selling pressure is mounting as volatility continues to drive uncertainty. Some analysts warn that further declines may follow if buyers fail to regain momentum, putting Bitcoin’s resilience to the test.
Top analyst Axel Adler highlights a key onchain signal that sheds light on the current market structure. According to Adler, Bitcoin’s Normalized Address Activity (NAA) dropped sharply from 60% — the level at which the $124,000 all-time high was formed — down to just 30%. This decline reflects a clear cooling in transactional intensity, with fewer coins moving on-chain. While this signals that short-term supply is weakening and immediate selling pressure has eased, it also raises questions about whether there is enough demand to fuel another rally.
The balance between cooling activity and sustained support will be decisive. If Bitcoin holds $110K and demand reemerges, the market could stabilize. But if volatility keeps pressuring buyers, the risk of deeper corrections remains firmly on the table.
Bitcoin Long-Term Seller Base Expands
According to Adler, while Bitcoin’s short-term supply activity has cooled, long-term dynamics reveal a different story. The annual Normalized Address Activity (NAA) has climbed from 30% — recorded when Bitcoin was trading near $80,000 — to 40% today. This steady increase shows that more holders are willing to realize profits at higher levels, gradually broadening the seller base.
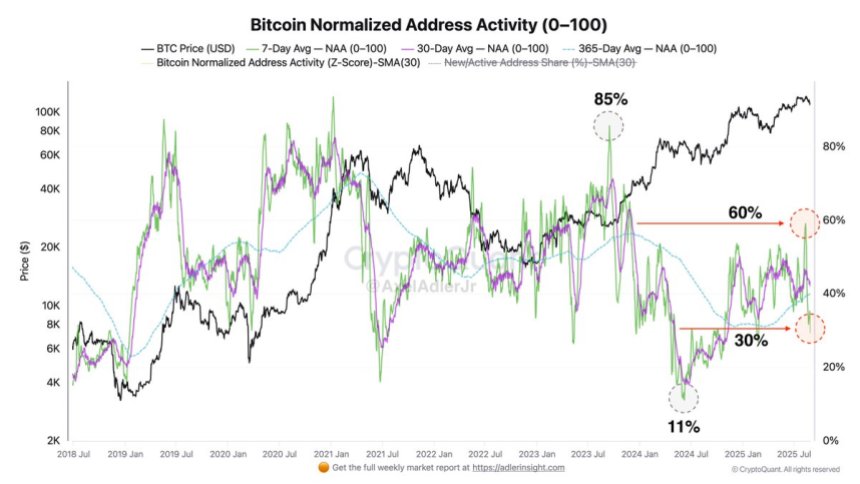
For context, the peak of selling activity in this cycle occurred in September 2023, when the annual NAA hit 85% with Bitcoin priced around $37,000. That marked a period of heavy distribution at lower valuations. By contrast, the current phase reflects a more balanced environment, where selling pressure is elevated compared to earlier this year but still far below peak cycle extremes. Adler suggests this positioning indicates Bitcoin has entered a “mid-stage” phase of distribution, where profit-taking grows but the structural trend remains intact.
Despite this, price action underscores hesitation. Bitcoin is holding above critical support at $110,000, but has so far failed to reclaim higher supply zones that would confirm bullish continuation. The market now sits at a crossroads, with speculation rising about the next major move. Whether buyers can overcome expanding long-term selling pressure will likely decide if Bitcoin stabilizes for another rally or faces a deeper corrective wave.
Bulls Push To Test Key Levels
Bitcoin is trading near $112,900 after a series of volatile swings that pushed the price down from recent highs above $123,000. The chart highlights how BTC has struggled to reclaim lost ground, with short-term momentum still capped by resistance levels. After defending the $110,000 zone, buyers are attempting a recovery, but the structure suggests that a more decisive move is needed to shift sentiment.
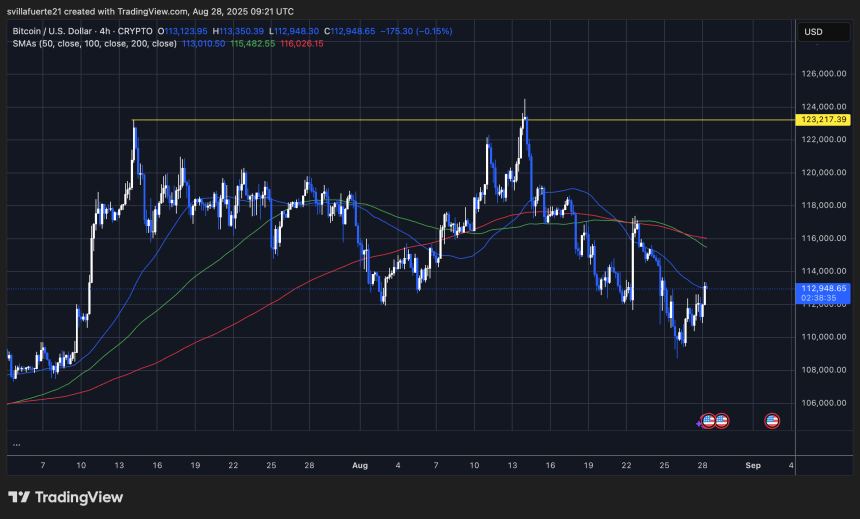
Currently, BTC remains below the 50-day and 100-day moving averages, which hover between $113,000 and $115,000. These levels form the immediate barrier for bulls, and breaking above them would be crucial to altering momentum in favor of an upside push. A successful retest and hold of $115,000 could signal the start of renewed strength, setting the stage for another attempt at the $120,000–$123,000 resistance zone.
On the downside, failure to break higher keeps BTC vulnerable. A rejection near current levels could open the door to another retest of $110,000 support, with deeper risks extending toward $108,000. Market sentiment remains cautious, and the next few sessions will likely determine whether Bitcoin can reclaim bullish momentum or remain stuck under pressure. For now, $115,000 stands as the critical line in the sand.
Featured image from Dall-E, chart from TradingView












 日本語
日本語  English
  Română
  Eesti
Eesti  한국어
한국어  Русский
  Deutsch
  Español
  简体中文
简体中文  Français
  繁體中文
繁體中文  Português
  Italiano
  Polski
  Türkçe
  Nederlands
  Bahasa Indonesia
  Ελληνικά
  Українська
  Български
  Čeština
  Suomi
Suomi  Magyar
  Latviešu valoda
  Lietuvių kalba
  Norsk bokmål
  Slovenčina
  Slovenščina
  Svenska
コメントを残す