
Ethereum is trading around $2.3k, posting its most constructive price action in months. For the first time since the correction began, ETH is showing genuine signs of a structural shift. Though the history of failed breakout attempts throughout this cycle demands that the current move be treated with measured optimism rather than outright conviction.
Ethereum Price Analysis: The Daily Chart
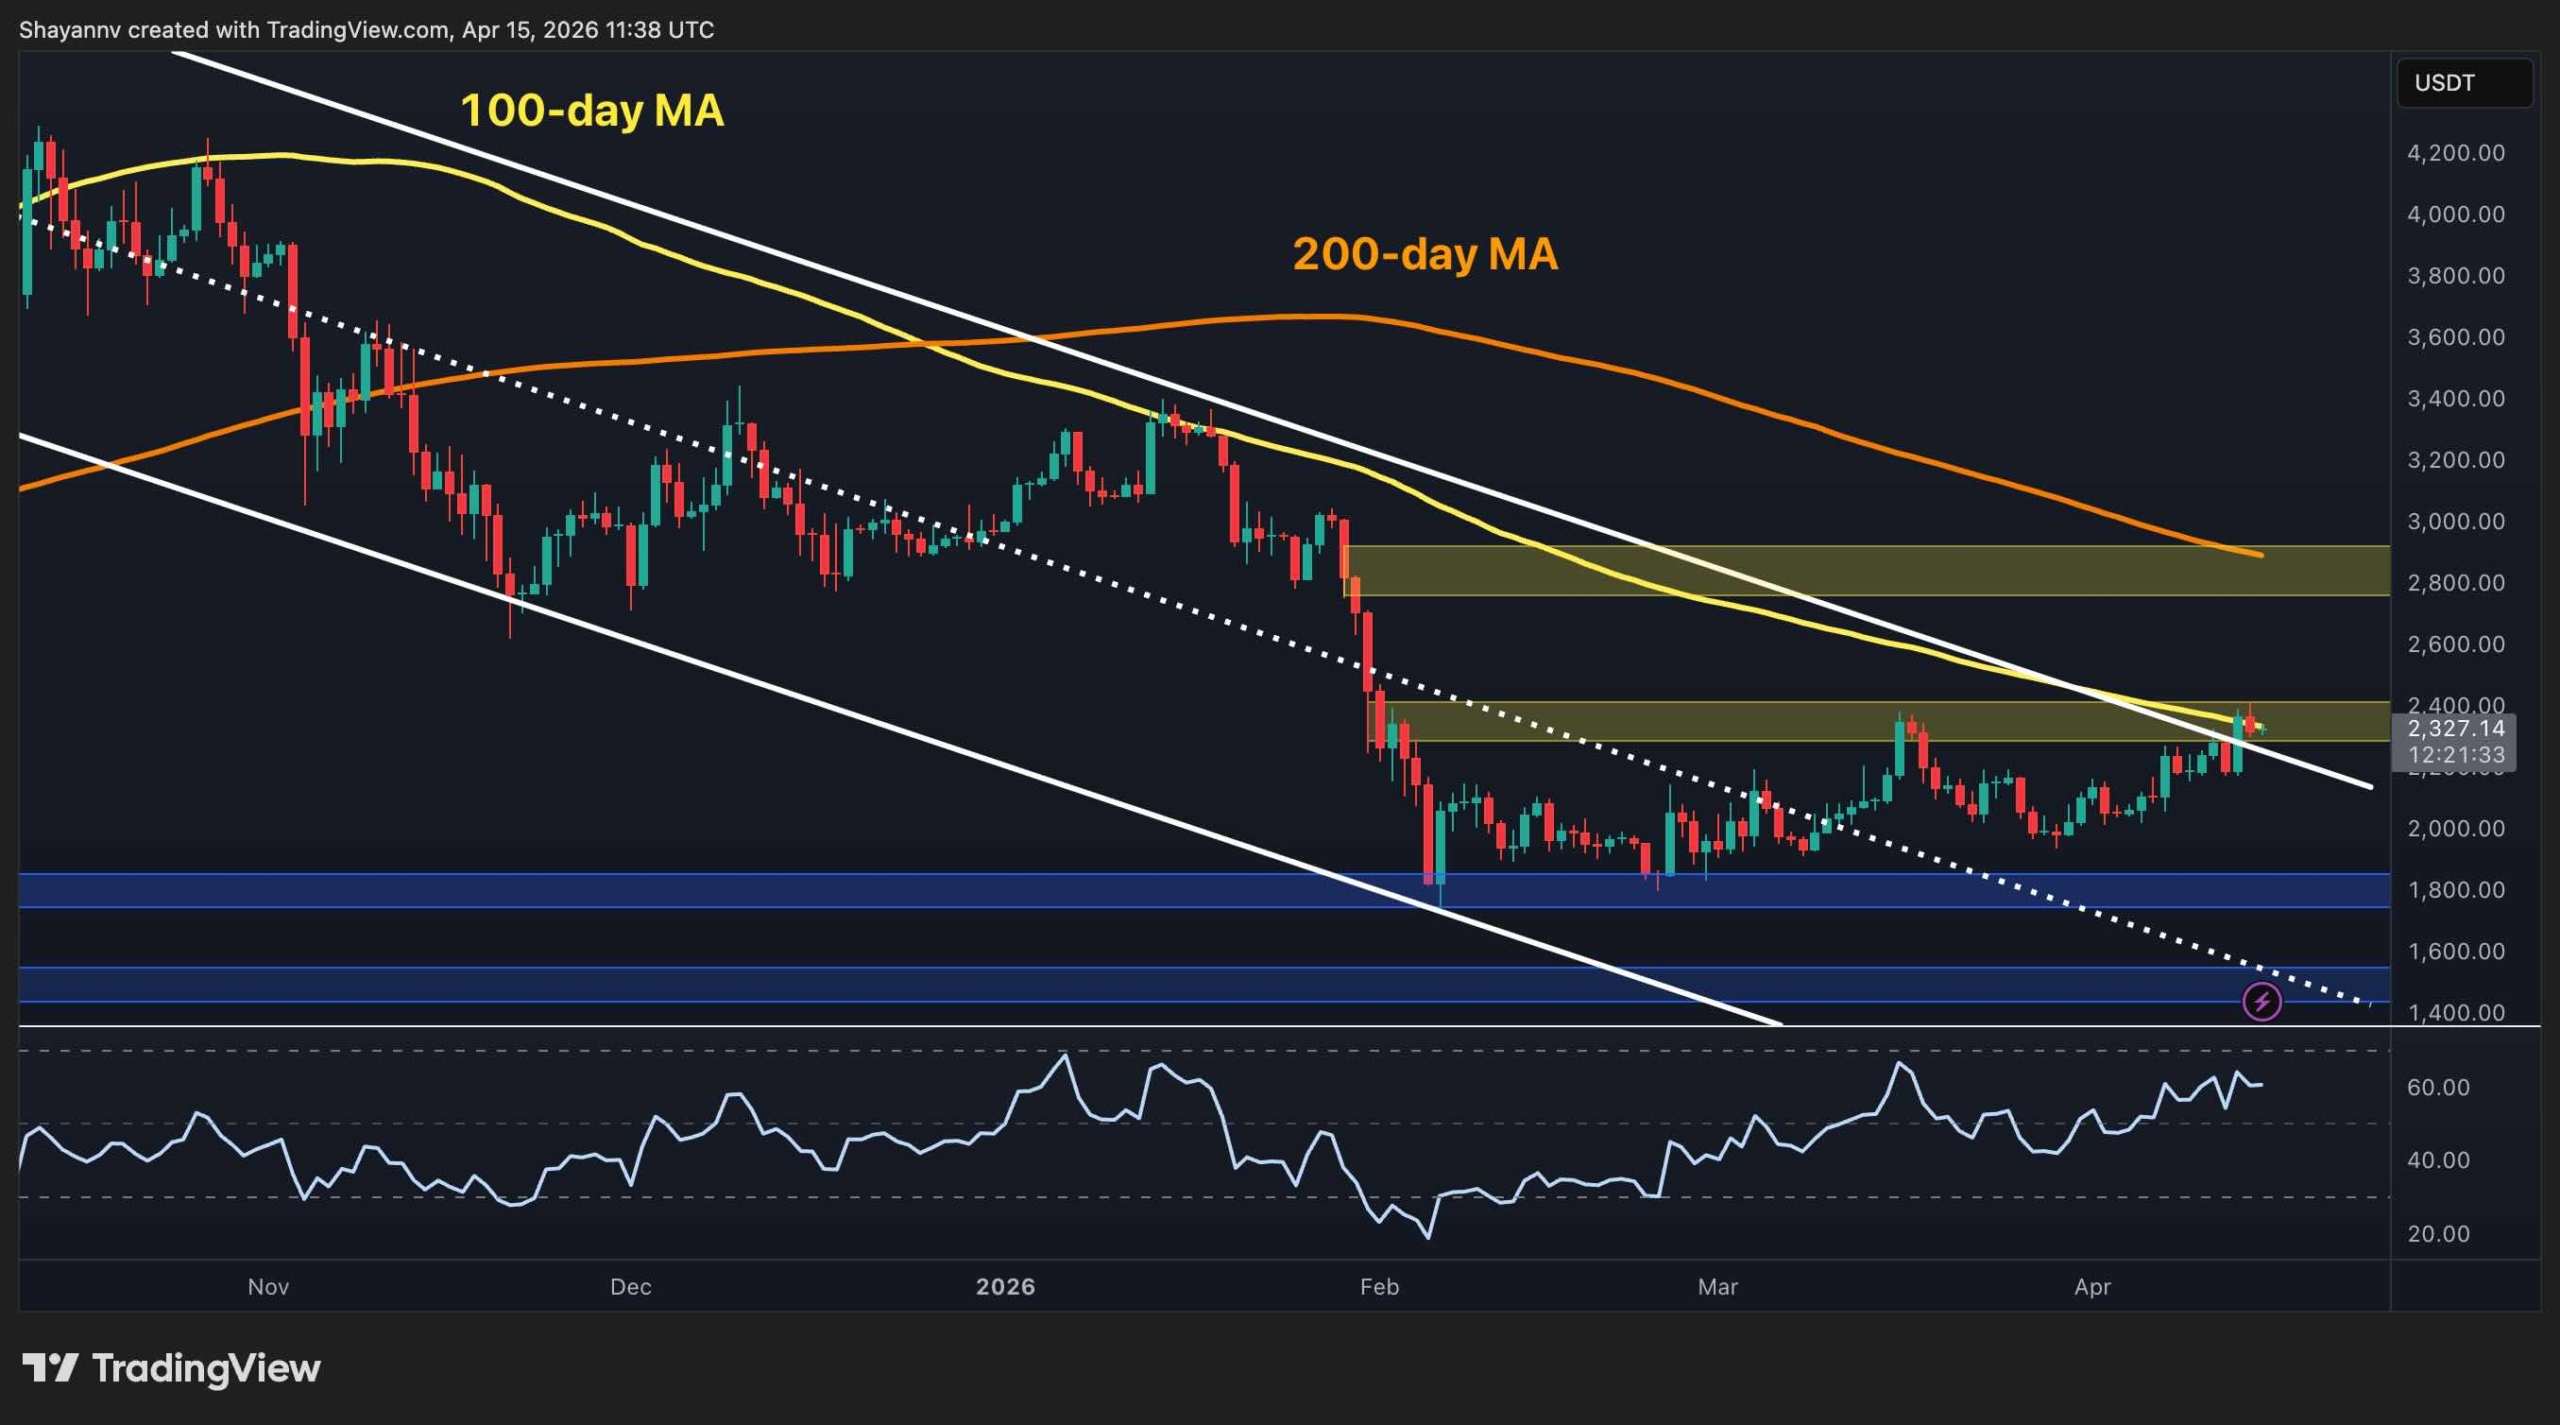
In a notable development on the daily chart, ETH is breaking above both the long-term descending channel’s upper boundary and the 100-day MA. These two levels have capped the price action for the past six months.
Therefore, the breakout, if sustained on a closing basis, would represent the most significant structural shift since the downtrend began in October 2025. The RSI trending into the high-50s to low-60s also supports the move with improving momentum rather than an overextended spike.
The immediate test is whether ETH can break and hold above the $2.4k zone on a daily close and build above it. The previous breakout attempt in mid-March faded quickly upon contact with this area.
Yet, if a confirmed breakout and hold above it occurs, it opens the door toward the $2.8k resistance zone. Meanwhile, a rejection and drop back inside the channel would be a discouraging false breakout, with the $1.8k area remaining the critical floor below.
ETH/USDT 4-Hour Chart
The 4-hour chart tells a more cautionary tale. ETH tried to push through the $2.4k resistance zone yesterday. The move initially looked like a clean breakout, but quickly reversed after the RSI reached overbought territory above, printing what appears to be another false bullish breakout from this well-tested supply area. The asset has since pulled back to around $2.3k, sitting just below the resistance band.
This is now the second time in recent months that ETH has tagged this zone with an overbought RSI and failed to hold above it. The ascending trendline from the February lows near $2k remains intact and continues to provide a rising floor.
A pullback toward that trendline that holds would keep the bullish structure alive, and a clean close above $2.4k on cooling momentum would be a far more convincing signal than the spike-and-reject pattern seen so far. However, the $1.8k support zone remains the key downside reference if the mentioned trendline gives way.

On-Chain Analysis
The February crash produced a massive spike in Ethereum’s active addresses, with daily activity briefly surging toward levels not seen over the past couple of years.
That sudden burst almost certainly reflects the chaos of a capitulation event — a wave of panicked selling, forced liquidations, and coins changing hands at distressed prices rather than organic demand entering the network. Spikes of this nature during sharp sell-offs tend to mark the moment of maximum fear rather than the beginning of a recovery.
What is more concerning is the trend that followed. Since that capitulation spike, active addresses have declined steadily, and the 30-day EMA has continued drifting lower.
This might point to lots of coins changing hands during the crash, but the market has not attracted fresh participants afterward to continue the trend higher. For ETH to build a sustainable recovery, active address trends need to turn upward consistently, not just spike during moments of stress. Until then, any price recovery will be harder to sustain over the medium term.

Il post Ethereum Price Analysis: What’s Next for ETH After the Most Constructive Gains in Months? è apparso per la prima volta su Criptopatate.


Lascia un commento