Ethereum remains under pressure after failing to reclaim a major resistance cluster. The price is now hovering around a key long-term support zone. The broader structure suggests sellers still dominate the market, while weakening demand from US investors adds another layer of caution.
Ethereum Price Analysis: The Daily Chart
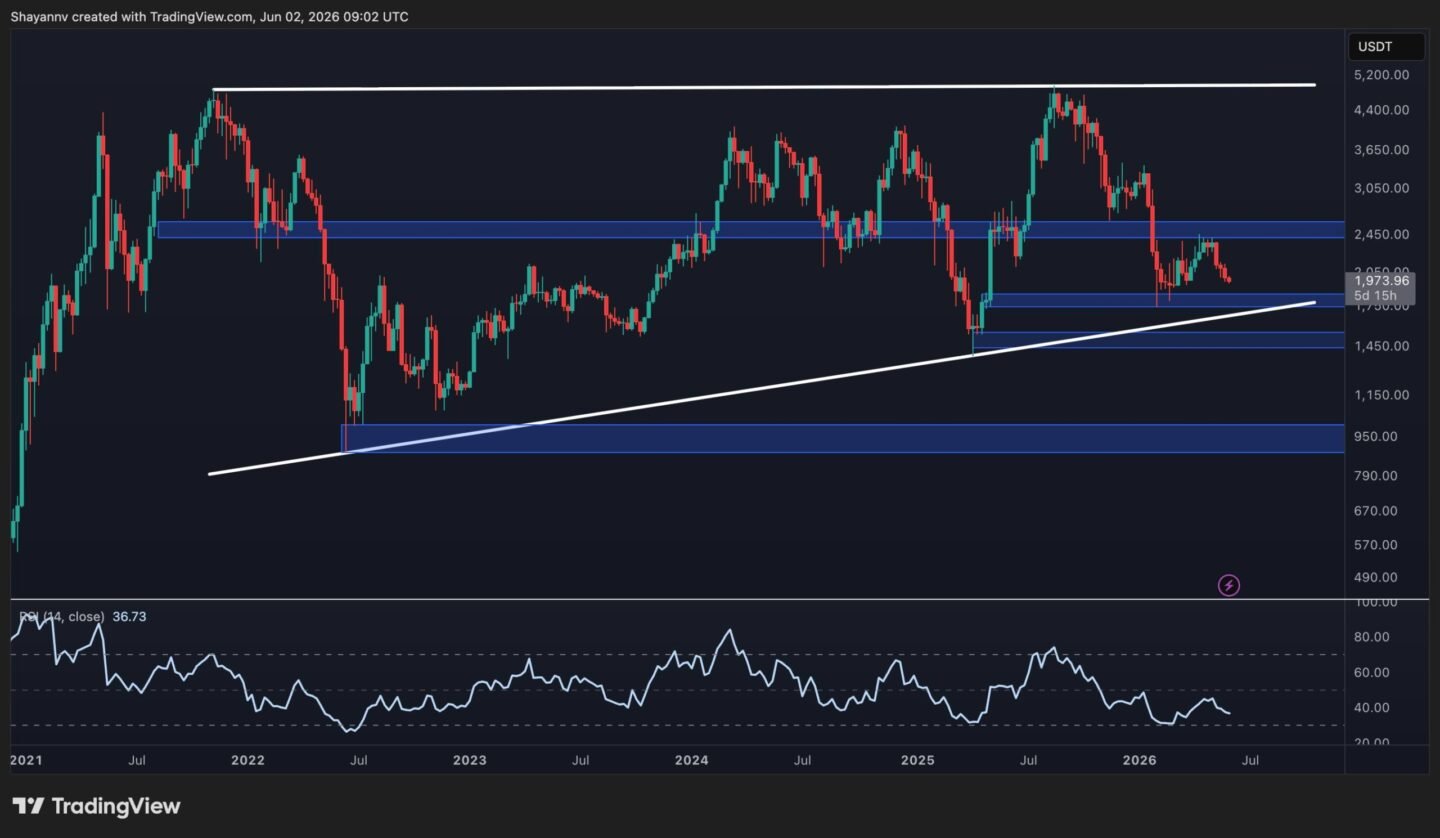
On the weekly timeframe, ETH has extended its rejection from the major horizontal resistance region around $2.4K. This zone has repeatedly acted as a pivotal level throughout the current cycle and has once again capped upside momentum. The rejection has pushed the asset back toward the ascending trendline that has supported the market since the 2022 bear market bottom.
ETH is currently trading around $2K, just above the trendline and the $1.8K demand zone. This area represents the most important support cluster on the chart, as it combines a horizontal support area with the long-term rising trendline.
As long as ETH remains above this confluence, the long-term market structure will be intact. However, a decisive breakdown below the trendline and the $1.8K support region could trigger a catastrophic correction toward the next major support area near $1,500 and cause more panic, even among long-term investors.
On the upside, the $2.4K zone remains the primary resistance. Reclaiming that area would be the first sign that buyers are regaining control and could open the door for a move toward $4.8K. Yet, with momentum conditions also remaining weak, as shown by the RSI, but not reaching the oversold region on the weekly timeframe, it seems that downside pressure has not fully exhausted itself. As a result, a deeper decline to test the critical support area is likely the scenario in the short-term.

ETH/USDT 4-Hour Chart
The 4-hour chart paints a similarly bearish picture. ETH continues to trade inside a descending channel. The channel is clearly identifiable by consistent lower highs and lower lows since mid-May. Following the rejection from the $2.15K supply zone, the market resumed its downward trajectory and is now returning to the lower boundary of the channel. The price is currently moving inside the $1.95K to $2K support area, which is preventing a sharper decline.
Yet, the bearish channel structure remains the dominant technical feature. As long as ETH stays below the upper boundary of the pattern and beneath the $2.15K resistance zone, short-term momentum favors sellers. A breakdown below the current support region could expose the liquidity pocket around $1.95k and potentially lead to a long liquidation cascade and push the price deeper to test the lower boundary of the channel.
Conversely, a successful defense of the $1.95k area followed by a breakout above the channel’s upper trendline would likely be the first indication of a broader recovery toward $2.15K and potentially the key weekly resistance at $2.4K.

Sentiment Analysis
The Coinbase Premium Index continues to signal weak spot demand from U.S. investors. The metric has remained predominantly in negative territory throughout May and has recently declined toward approximately -0.13. This is one of its lowest readings in the past year.
Historically, sustained positive Coinbase Premium readings tend to accompany periods of strong institutional and U.S.-based buying activity. In contrast, the current negative values indicate that ETH is trading at a discount on Coinbase relative to offshore exchanges, suggesting weaker demand from a key segment of the market.
This weakness aligns with Ethereum’s ongoing downtrend and helps explain the market’s inability to reclaim the $2.4K resistance zone. While deeply negative Premium readings can sometimes precede local bottoms as selling pressure becomes exhausted, the metric currently shows little evidence of aggressive accumulation. So, unless the Coinbase Premium Index begins to recover and move back toward positive territory, supply and demand dynamics continue to support the cautious outlook implied by the technical structure.

Virka Ethereum Price Prediction: How Low Can ETH Go If $2K Support Decisively Cracks? ilmestyi ensin osoitteessa CryptoPotato.


Vastaa