Ethereum is still locked in a broad corrective structure. The price action shows continued indecision rather than directional conviction, which seems fair given the escalations in the Middle East. Despite holding above the $1.8k support base, upside attempts are consistently capped before any meaningful trend shift can develop.
Ethereum Price Analysis: The Daily Chart
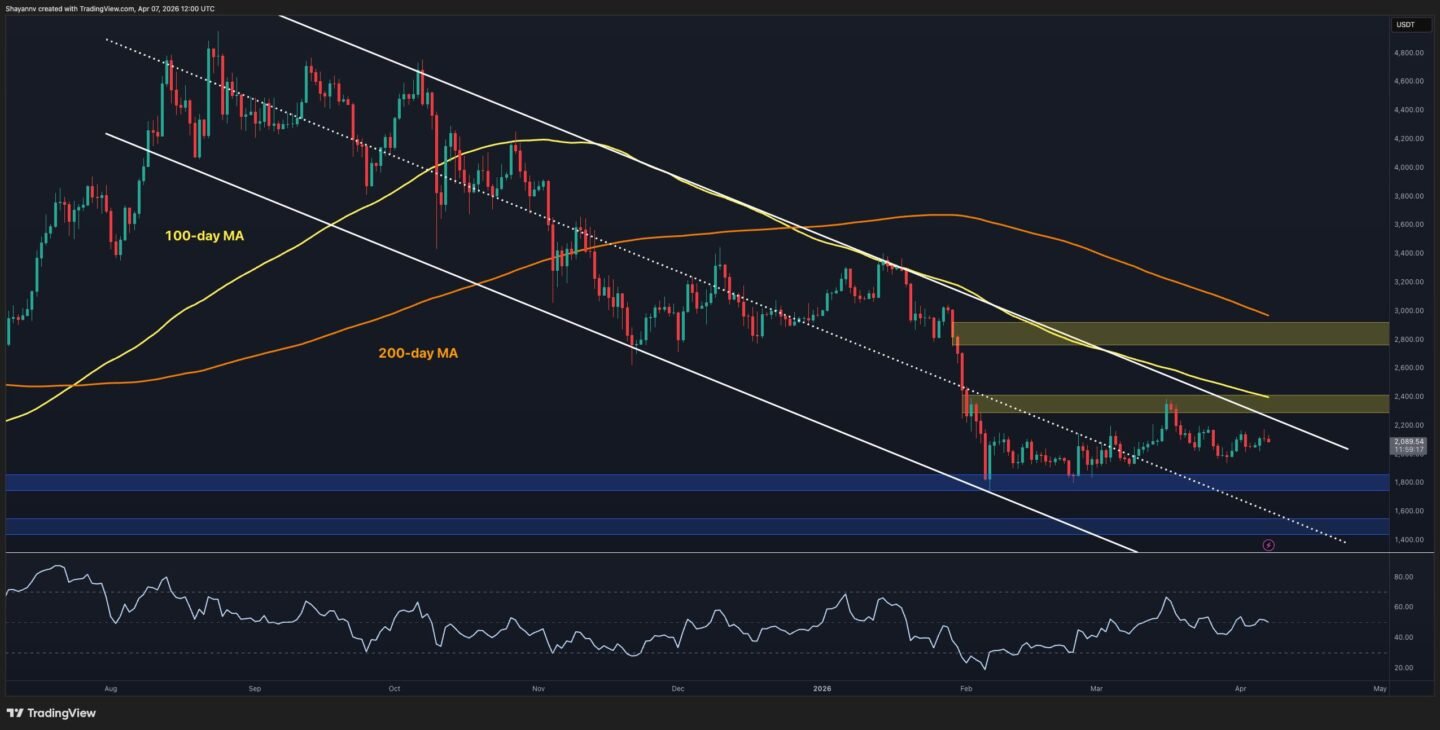
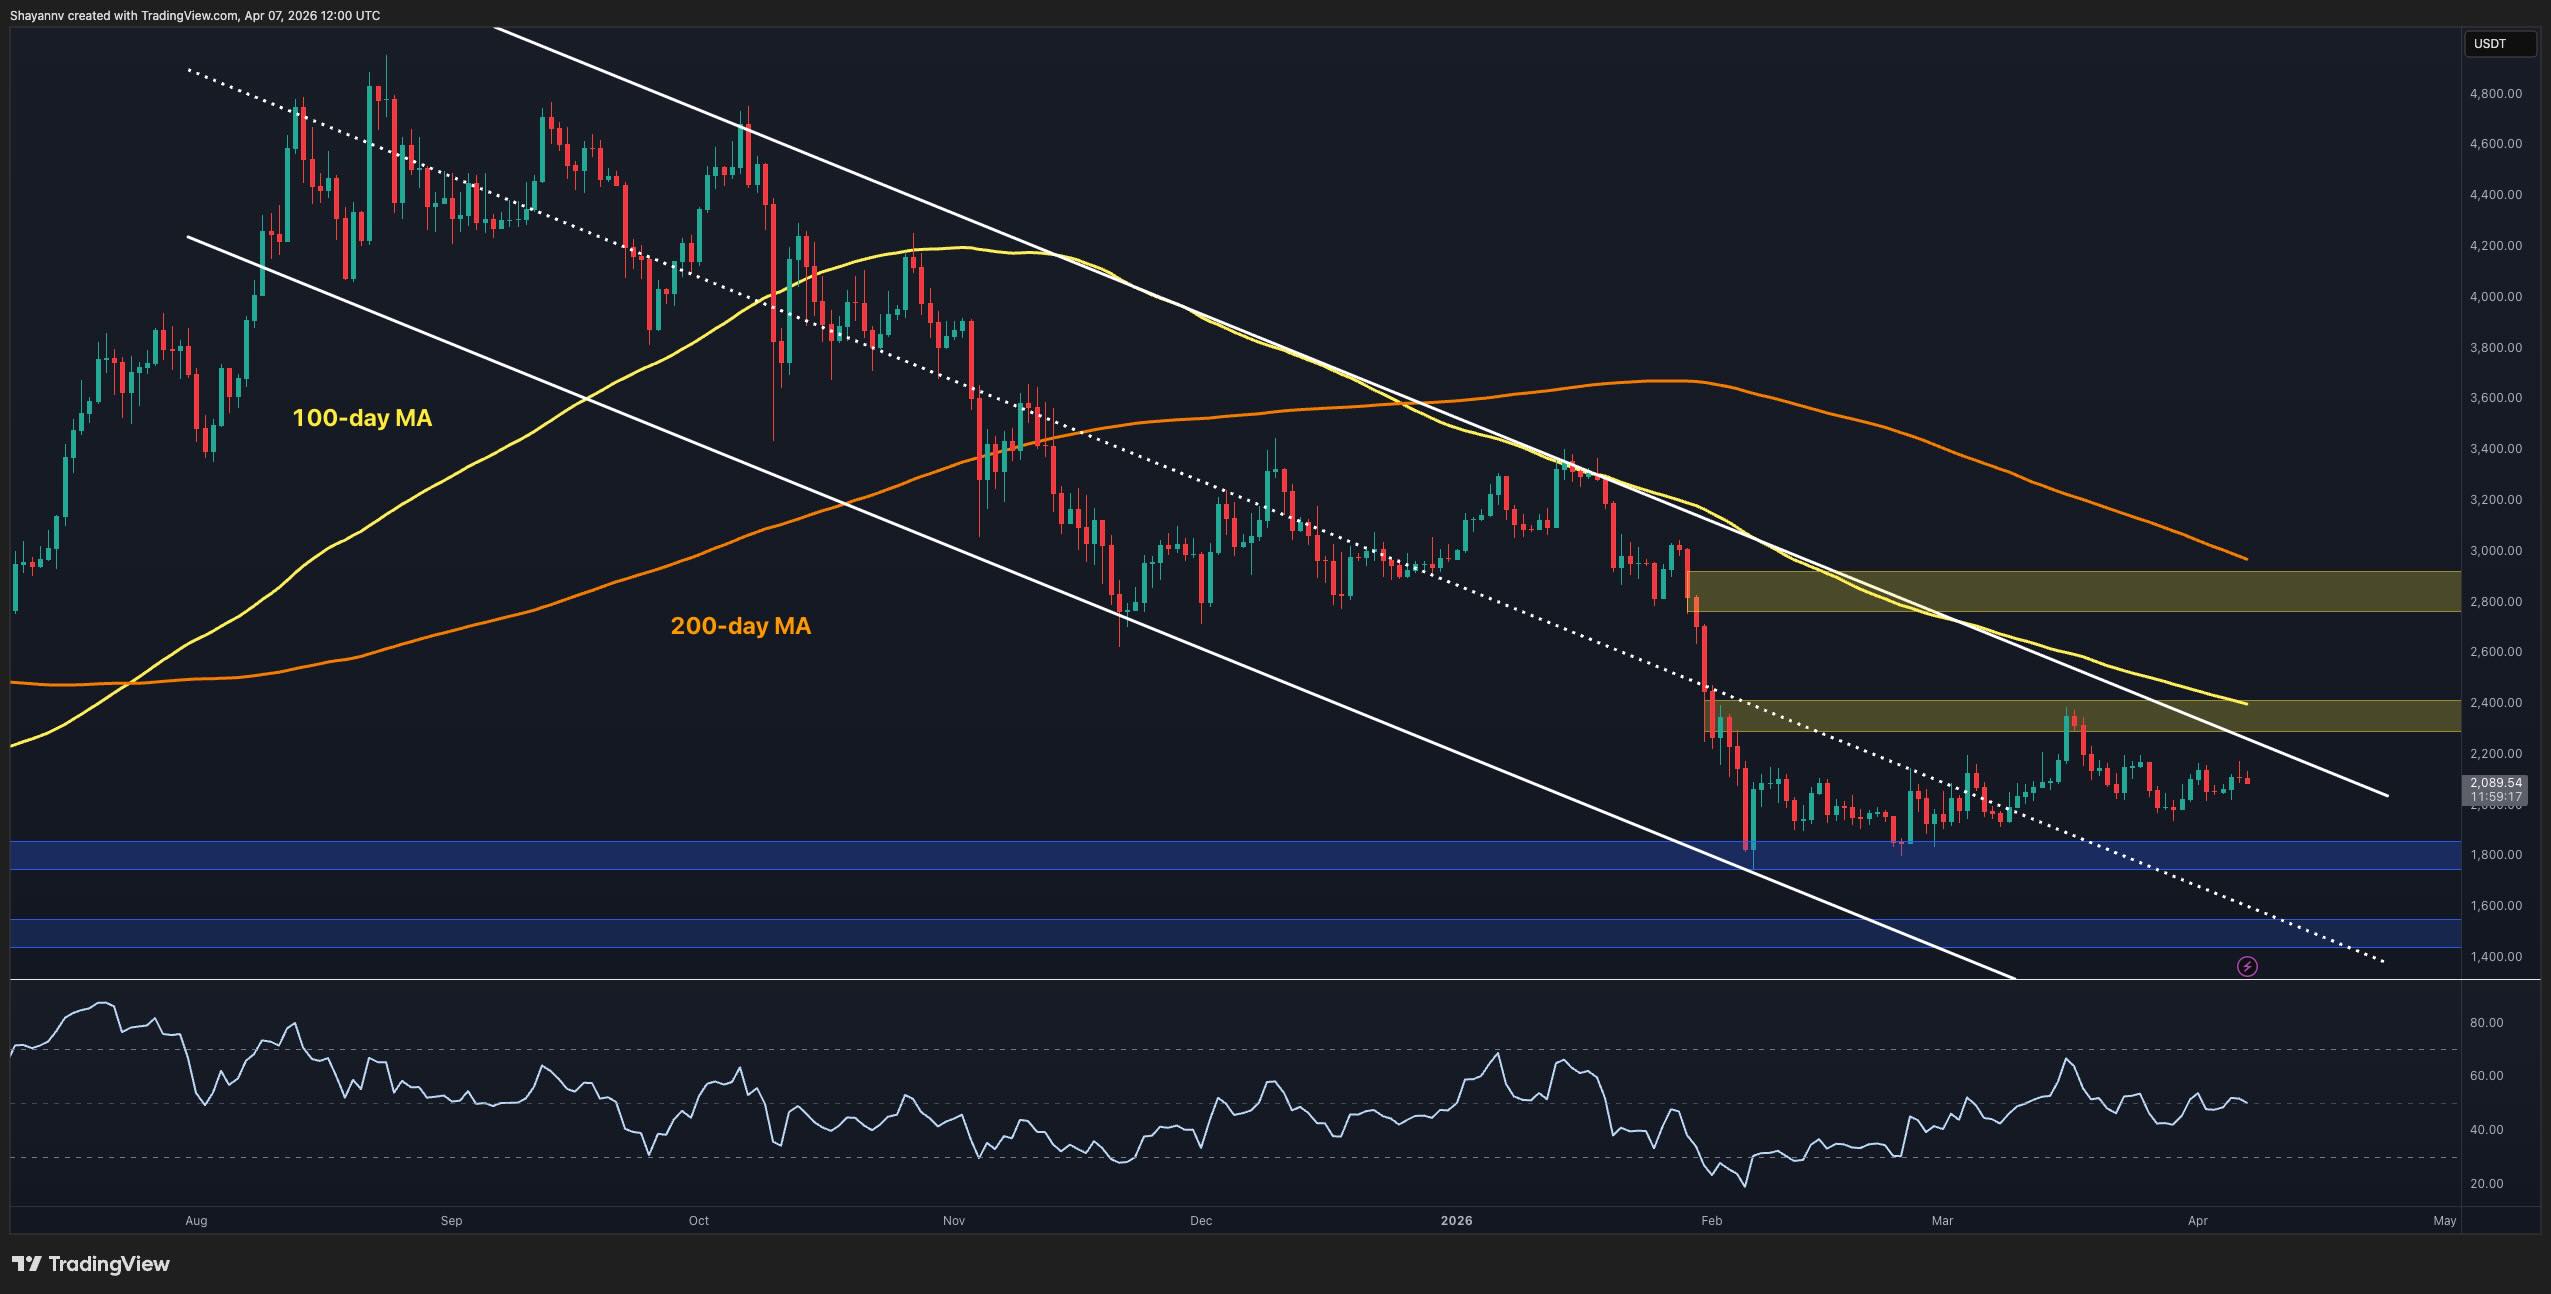
On the daily timeframe, ETH is still trading within a large descending channel. This confirms a broad bearish market structure that began in late 2025. The price also remains below both the 100-day (~$2.4k) and 200-day ($3k) moving averages, which continue to trend downward and act as dynamic resistance layers.
Currently, the $2.3k–$2.4k zone is the key supply area. This region has repeatedly rejected price and aligns with the most recent bearish order block on the daily timeframe. Meanwhile, the $1.8k region acts as a critical support area. This level has held multiple times, and as long as it holds, the downside remains contained within the current range.
A decisive break above $2.4k would invalidate the sequence of lower highs and potentially shift the structure toward a bullish reversal, as it would also mean a break above both the descending channel’s higher boundary and the 100-day moving average. Conversely, losing the $1.8k demand zone would likely trigger a breakdown from the range and open the door for a deeper move toward the next support level at $1.6k.
ETH/USDT 4-Hour Chart
On the 4-hour timeframe, ETH is consolidating within a narrowing triangle structure. This pattern is defined by a rising trendline from the $1.8k lows and the key horizontal resistance around $2.4k.
The price is currently trading around $2.1k. It has repeatedly tested the $2.2k short-term resistance zone formed with recent 4-hour timeframe highs, but has failed to break through it with conviction. With the lower trendline of the triangle also converging from below, the structure suggests compression, and a breakout is becoming increasingly likely.
If buyers manage to flip $2.2k into support, the next move would likely target the key $2.4k supply zone. However, failure to break higher and a loss of the ascending trendline would shift momentum bearish, exposing the $1.8k support area in the coming weeks.

Sentiment Analysis
The Taker Buy/Sell Ratio is currently pushing higher and has been showing consistent readings above 1 over the past month. This indicates that aggressive buyers are becoming more active in the market.
However, this increase in taker buy pressure is occurring within a broader downtrend and range environment. Historically, similar spikes have often appeared near local tops or during short-term relief rallies, rather than marking the beginning of sustained uptrends.
This suggests that while short-term sentiment is improving, it may be driven more by speculative positioning than strong spot demand. As a result, if price fails to break the $2.4k resistance soon, this buildup of aggressive longs could unwind, leading to significant downside volatility, which could further prolong the overall bearish trend.

Der Posten Ethereum Price Analysis: Is ETH About to Break Out of Consolidation? erschien zuerst auf KryptoKartoffel.


Schreibe einen Kommentar