Ethereum is trading at $2.32k as the first weekend of May unfolds, caught in the same technical gridlock it has been trapped in for the past three weeks. The asset is pressing against the $2.4k resistance zone with neither the conviction to break through nor the weakness to collapse below the ascending channel that has supported the recovery since February.
What continues to change, however, is the on-chain picture beneath the surface. Exchange reserves have just hit another low, as the supply is being quietly withdrawn from exchanges.
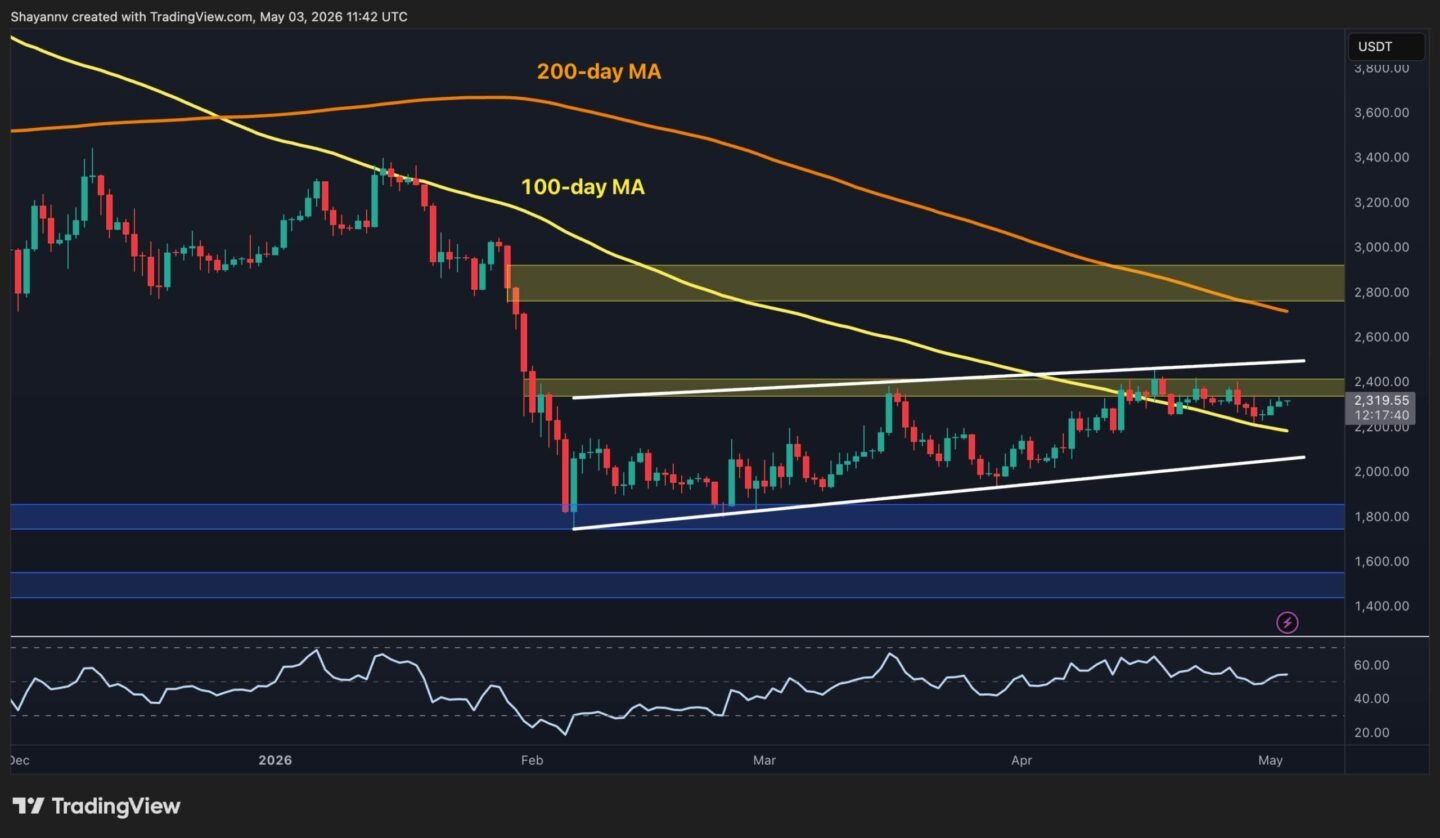
Ethereum Price Analysis: The Daily Chart
ETH is once again testing the vicinity of the declining 100-day MA from above, as the moving average now sits at approximately $2.2k.The RSI is also hovering around 55, indicating a market neither building nor losing momentum. The ascending white channel from the February low remains intact, with its lower boundary providing support near $2k.
Above, the $2.4k supply zone remains the only level that changes the narrative. A daily close through it would simultaneously represent a horizontal resistance break and likely, a retest of the 200-day MA (~$2.7k). This potential breakout would essentially open the door toward the $2.8k critical supply zone. On the other hand, a failure to hold above $2.2k and the 100-day MA on the next pullback would begin to threaten the channel structure and refocus attention on the $1.8k demand area.

ETH/USDT 4-Hour Chart
The falling wedge that formed after the mid-April high near $2.4k is tightening further on the 4-hour chart. The price is now sitting just below the higher boundary, around $2.35k, moving toward it once more. The RSI has also recovered above 50 on this timeframe, but it is yet to offer a strong directional signal.
The $2.4k resistance zone has capped every recent attempt to push higher since, and that remains the immediate ceiling. A close above it resolves the wedge bullishly and targets the larger channel’s higher boundary near $2.5k. Lower, a break below the wedge and the recent low near $2.2k would invalidate the pattern and lead to a potential drop toward the lower trendline of the ascending channel near $2.1k.

On-Chain Analysis
Ethereum’s exchange reserve has fallen to 14.5M ETH, which is the lowest level recorded in this entire dataset. At its recent peak, exchanges held over 21M ETH; that figure has declined persistently through the bull market, through the correction. The metric is now accelerating even lower, with over 1.5M ETH withdrawn from exchanges in the past four months alone.
The structural implication is significant, as with less ETH available on exchanges than at any point in recent years, the liquid sell-side supply that typically caps recoveries is shrinking. This does not guarantee a breakout above $2.4k, because demand still needs to materialize.
However, it does mean that when buyers do step in with conviction, they will face a thinner order book than at any prior point this cycle. The divergence between steadily declining reserves and a price that remains stuck below resistance is the kind of setup that tends to resolve sharply once the technical catalyst arrives.

Публикацията Ethereum Price Analysis: $2.4K Remains ETH’s Biggest Barrier appeared first on CryptoPotato.


Вашият коментар